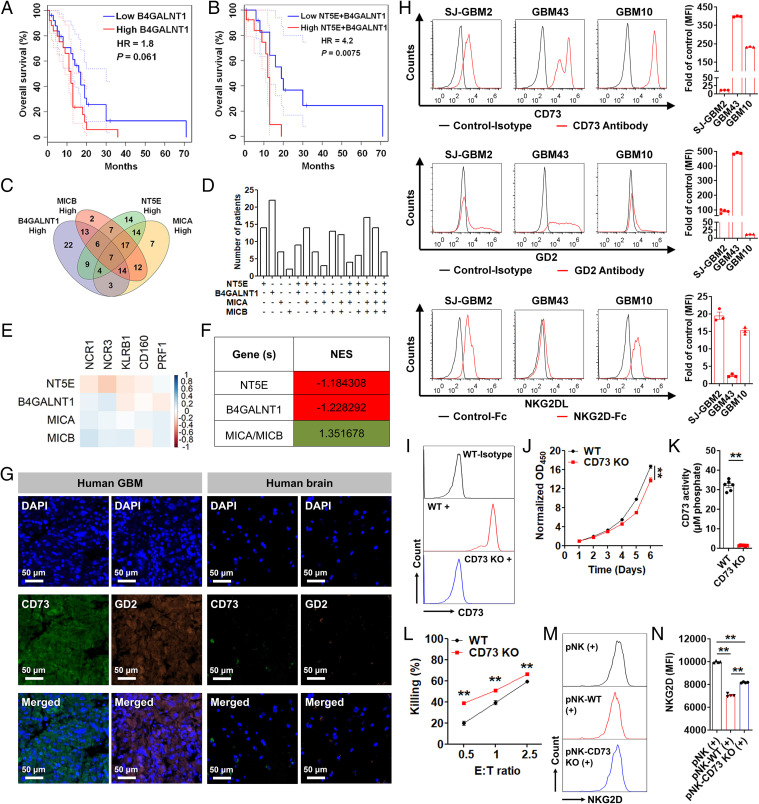
Fig. 1.
Functional and prognostic role of CD73, GD2, and NKG2DL in GBM. (A and B) OS of GBM patients with the mesenchymal subtype based on NT5E and NT5E + B4GALNT1 expression, respectively. (C) Venn diagram showing the number of GBM patients with high expression of at least one of the four genes. (D) Bar graph showing the GBM patient distribution based on gene expression in C. (E) Correlation between normalized expression of selected genes. Pearson's correlation coefficients are shown with continuous gradient colors. (F) Correlation between normalized expression of the indicated genes and the NK signature gene set. Correlation expressed as NES. (G) A representative human GBM tumor section double stained with anti-CD73 antibody (green) and anti-GD2 antibody (orange). A normal brain tissue (cerebrum) was used as a control. (Scale bar: 50 μm; 200× magnification.) (H) Surface expression of CD73, GD2, and NKG2DL on patient-derived GBM cells. Results are reported as fold change over control (n = 3 or 4). (I) Representative histograms depicting the surface expression of CD73 on GBM43 WT and GBM43 CD73 KO cells. (J) In vitro proliferation of GBM43 WT and GBM43 CD73 KO cells (n = 6). (K) Enzymatic activity of CD73 on GBM43 WT and GBM43 CD73 KO cells (n = 6). (L) In vitro cytotoxicity of pNK cells against GBM43 WT and GBM43 CD73 KO cells at indicated E/T ratios over 4 h (n = 5). (M and N) NKG2D expression (MFI) on pNK cells after coincubation with GBM43 WT and GBM43 CD73 KO cells at an E/T ratio of 0.5/1 over 48 h (n = 4). Data represent independent samples. Data are shown as mean ± SEM, **P < 0.01. P values in J, K, and L were determined using the two-tailed Student’s t test and in N using one-way ANOVA analysis.

