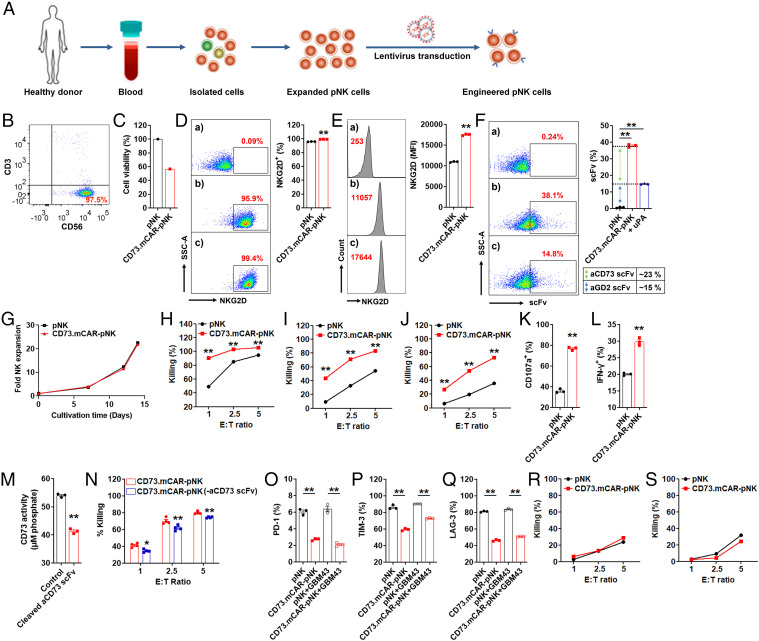
Fig. 3.
Generation of CD73.mCAR-pNK cells and in vitro evaluation of their activity. (A) Process for generating CD73.mCAR-pNK cells. (B) Flow cytometry dot plot showing the purity of isolated peripheral blood-derived NK (pNK) cells (CD56+CD3−) after expansion. (C) Cell viability (%) of pNK cells immediately after two rounds of transduction. We set control pNK as 100%. (D and E) NKG2D expression on CD73.mCAR-pNK cells. D indicates % level. E indicates MFI level. a–b represent pNK cells stained with isotype and APC-anti-NKG2D antibodies. c represents CD73.mCAR-pNK cells stained with APC-anti-NKG2D antibody. (F) Expression of anti-CD73 scFv and anti-GD2 scFv on CD73.mCAR-pNK cells. uPA (100 nM) was used to release the anti-CD73 scFv fragment. (Left) Representative flow cytometric dot plot. a represents pNK cells stained with Biotin-Protein L + APC-streptavidin, b–c represent non-treated and uPA-treated CD73.mCAR-pNK cells, respectively stained with Biotin-Protein L + APC-streptavidin. (Right) Calculation of anti-CD73 scFv and anti-GD2 scFv expression (%). (G) Fold expansion of pNK and CD73.mCAR-pNK cells in NK MACS medium. (H–J) In vitro cytotoxicity of control pNK and CD73.mCAR-pNK cells against SJ-GBM2, GBM43, and GBM10 cells at indicated E/T ratios over 4 h, respectively (n = 3 or 5). (K) Degranulation of pNK and CD73.mCAR-pNK cells (% CD107) after 4 h coculture with GBM43 cells (E/T ratio, 5:1) (n = 3). (L) IFN-γ production by pNK and CD73.mCAR-pNK cells (% IFN-γ) after 4 h coculture with GBM43 cells (E/T ratio, 5:1) (n = 3). (M) CD73 activity on GBM43 cells after incubation with cleaved aCD73 scFv following cleavage from uPA-treated CD73.mCAR-NK cells (n = 3). (N) In vitro cytotoxicity of pNK and CD73.mCAR-pNK (following aCD73 scFv cleavage) cells against GBM43 cells at indicated E/T ratios over 4 h (n = 4). (O–Q) Expression (%) of PD-1, TIM-3, and LAG-3 on both pNK and CD73.mCAR-pNK cells after 12 h coculture with or without GBM43 cells (E/T ratio, 5:1) (n = 3). (R and S) In vitro cytotoxicity of pNK and CD73.mCAR-pNK cells against nonmalignant neural cells hCMEC/D3 and HCN-2 at indicated E/T ratios over 4 h (n = 4). Data shown here stand for one representative from four donors. “n” means independent repeats. Data are shown as mean ± SEM, *P < 0.05, **P < 0.01. P values in D, E, H, I, J, K, L, M, and N were determined using the two-tailed Student’s t test and in F, O, P, and Q using one-way ANOVA analysis.

