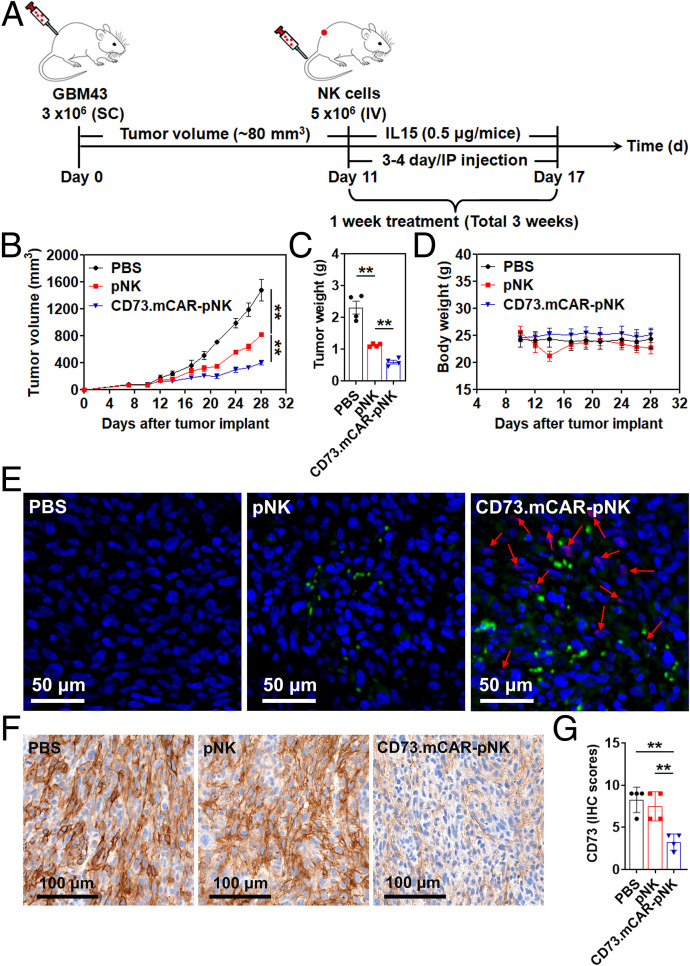
Fig. 4.
In vivo activity of CD73.mCAR-pNK cells in a patient-derived GBM xenograft model. (A) Schematic diagram illustrating the in vivo treatment program. (B) Tumor growth of individual groups. (C) Tumor weight of the mice after necropsy on day 28 post-tumor implantation. (D) Body weight of the mice during the treatment period. (E) Immunofluorescence staining of NK cells (green) and cleaved anti-CD73 scFv (arrows; red) performed on representative tumor sections using anti-NKp46 antibody and Protein L. (Scale bar: 50 μm; 200× magnification.) (F) IHC staining of CD73 performed on representative tumor sections using anti-CD73 antibody. (Scale bar: 100 μm; 200× magnification.) (G) IHC scores of CD73 expression performed on representative tumor sections in each group. Data were measured from independent samples. Data are shown as mean ± SEM, **P < 0.01. P values in B, C, and G were determined using one-way ANOVA analysis.

