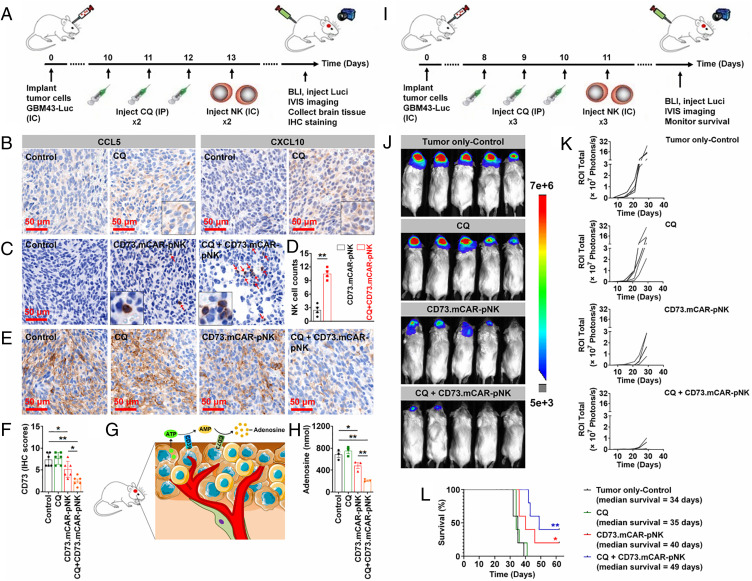
Fig. 6.
In vivo activity of CD73.mCAR-pNK cells and the combination immunotherapy with the pharmacological inhibition of autophagy in an orthotopic patient-derived GBM xenograft model. (A–H) Validation of the mechanisms involved in the combination therapy (four mice/group). (A) Schematic diagram showing the treatment program. (B) IHC staining of CCL5 (Left) and CXCL10 (Right) performed on indicated tumor sections in each group. (Scale bar: 50 μm; 200× magnification.) (C) IHC staining for NK cells performed on tumor sections from indicated groups. (Scale bar: 50 μm; 200× magnification.) (D) Quantification of NK cell infiltration into tumors. Here, cell counts were recorded in four consecutive high-power fields. (E) IHC staining for CD73 performed on tumor sections from indicated groups. (Scale bar: 50 μm; 200× magnification.) (F) IHC scores of CD73 expression performed on tumor sections. (G) Schematic diagram showing extracellular adenosine production in the GBM tumor microenvironment. (H) Adenosine concentration in local brain tissues of mice in each group (n = 3). (I–L) Evaluation of the efficacy of the combination therapy in GBM (five mice/group). (I) Schematic diagram showing the treatment program. (J) Bioluminescence imaging of mice on day 29 after tumor implantation (3-wk treatment program). (K) Tumor growth for individual mice over time monitored using bioluminescence imaging. (L) Kaplan–Meier plot showing mouse survival. Data were measured from independent samples. Data are shown as mean ± SEM, *P < 0.05, **P < 0.01. P values in D were determined using the two-tailed Student’s t test and in F and H using one-way ANOVA analysis. P values in L were determined using log-rank test.

