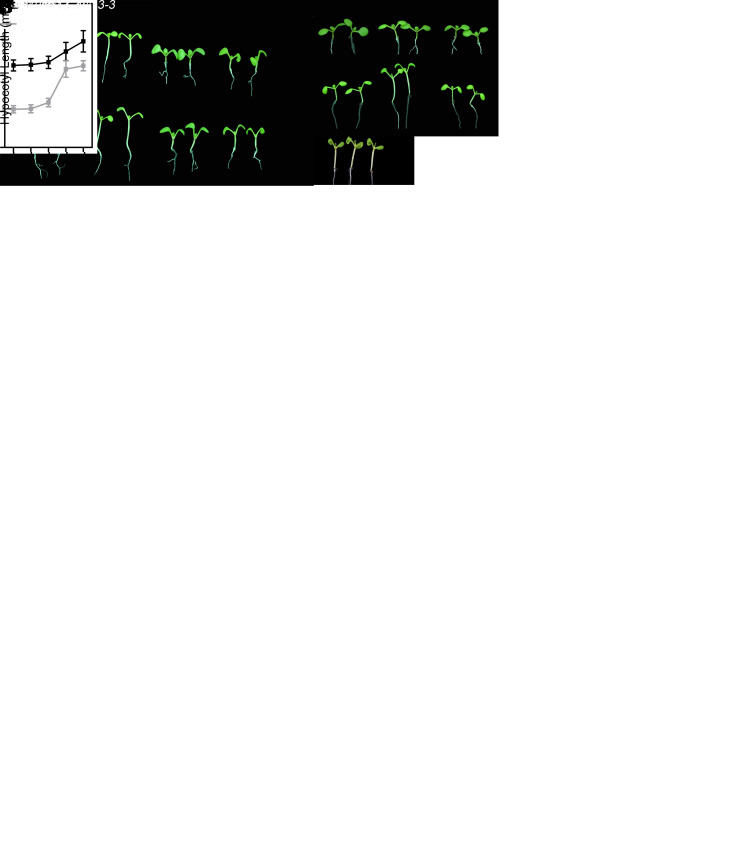
Fig. 2.
The promotion of shade responses by UBP12 and UBP13 depends on the function of PIF7. (A) Phenotypes of WT (Col-0), phyB, ubp12-2w/13–3, and phyB/ubp12-2w/13–3 under WL and SL conditions. (Scale bar: 1 cm.) (B) Hypocotyl lengths of plants shown in A. The values shown are mean ± SD (n ≥ 20). *P < 0.05 and **P < 0.01; based on Student’s t test. (C) The hypocotyl response of WT (Col-0) and ubp12-2w/13–3 grown under WL and SL to PIC treatment. The seedlings were grown on the medium with different concentrations (0, 0.01, 0.1, 1.0, and 2.0 µM) of PIC and kept under WL for 4 d before being transferred to shade or remaining under WL for an additional 4 d. (Scale bar: 1 cm.) (D and E) Hypocotyl lengths of seedlings indicated in C under WL (D) and SL (E). The values shown are mean ± SD (n ≥ 20). *P < 0.05 and **P < 0.01; based on Student’s t test. (F–I) The expression of shade-induced genes in WT (Col-0) and ubp12-2w/13–3 under WL and SL conditions. The values shown are mean ± SD. *P < 0.05 and **P < 0.01; based on Student’s t test. (J and K) Genetic interaction between PIF7 and UBP12/UBP13 in SAR. Hypocotyl phenotypes and lengths are shown in J and K, respectively. (Scale bar: 1 cm.) The values shown are mean ± SD (n ≥ 20). *P < 0.05 and **P < 0.01; ns, not significant (P ≥ 0.05); based on Student’s t test. (L and M) The expression of shade response genes in various genotypes shown in J and K. Plants were grown under WL for 7 d, and then half of them were treated under SL for 4 h. The values shown are mean ± SD. *P < 0.05 and **P < 0.01; ns, not significant (P ≥ 0.05); based on Student’s t test.

