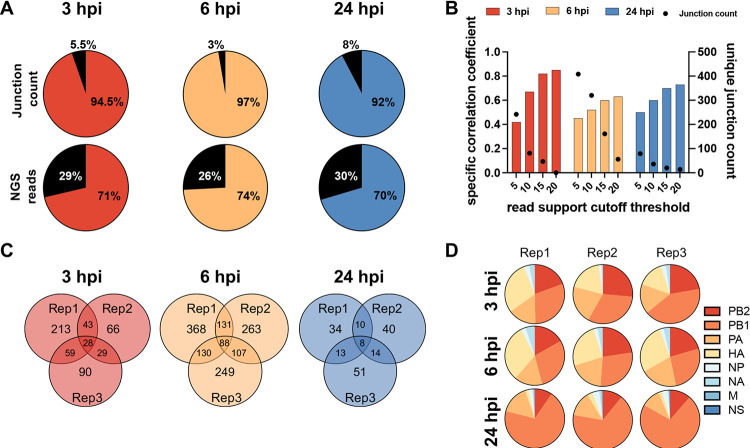
FIG 1.
DelVG formation is partially stochastic and biased toward the polymerase and HA segments. (A) Pie charts show the proportional percentages of the total normalized junction counts and DelVG-mapping NGS read counts found in the inoculum relative to the unique junctions found in the three replicates collected at the indicated time points. The black fractions represent the junctions that were detected in the inoculum. (B) Correlation of distinct junctions in the PB2 segment between two technical replicate samples (generated from the same RNA sample) using different NGS read cutoff values. (C) Venn diagram showing the overlap in specific junctions (for the PB2 segment) between three replicate samples collected at each time point. (D) Pie charts show the proportional abundance of normalized junction counts from each genome segment across replicates. Data in this figure are from one experiment but are representative of three independent experiments.

