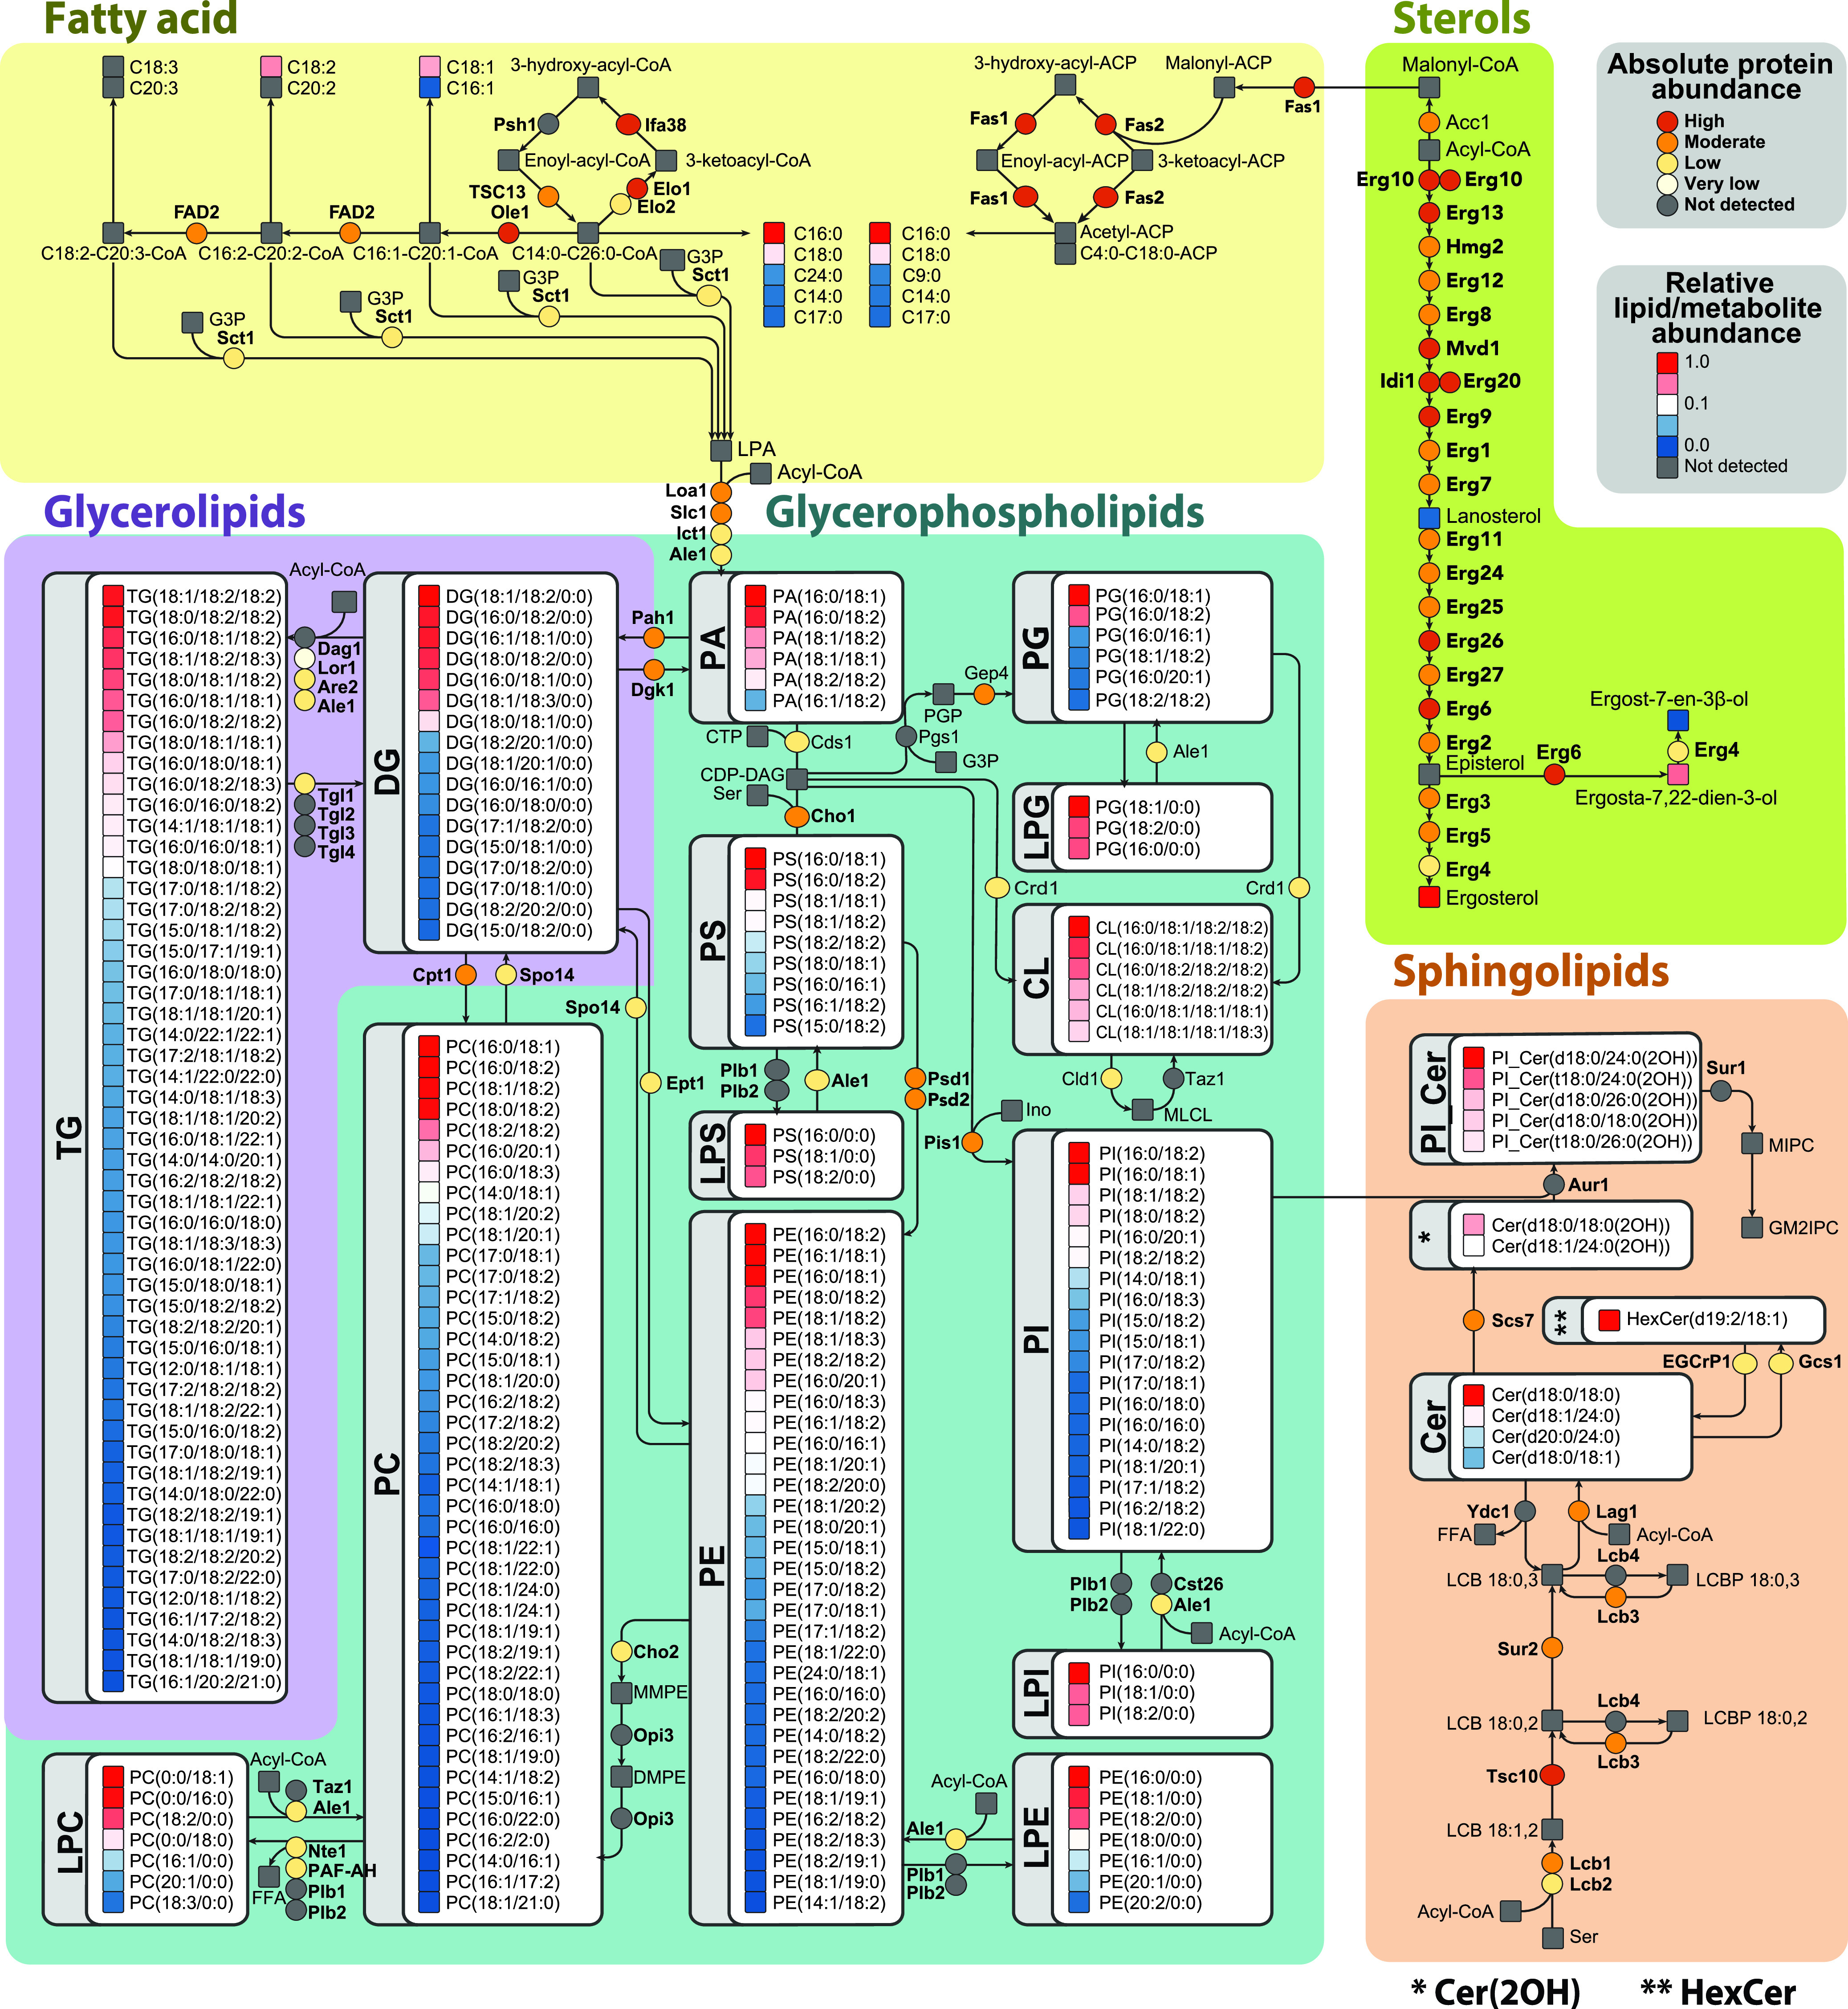
FIG 2.

Metabolic map of Histoplasma capsulatum lipids and biosynthesis proteins. The map was built based on genomic information along with proteomics and lipidomics data. Lipid abundances were normalized by the most intense signal in the mass spectrometry analysis within each lipid class, whereas the proteins were quantified based on their relative copy number. For details about enzyme names and homologs, see Table S10 at https://osf.io/ku8ta/. Abbreviations: Cer, ceramide; CL, cardiolipin; DG, diacylglycerol; HexCer, hexosylceramide; LPC, lysophosphatidylcholine; LPE, lysophosphatidylethanolamines; LPG, lysophosphatidylglycerol; LPI, lysophosphatidylinositol; LPS, lysophosphatidylserine; M, methanol; PA, phosphatidic acid; PC, phosphatidylinositol; PE, phosphatidylethanolamine; PG, phosphatidylglycerol; PI, phosphatidylinositol; PI_Cer, inositolphosphoceramide; PL, phospholipid; PS, phosphatidylserine; TG, triacylglycerol.
