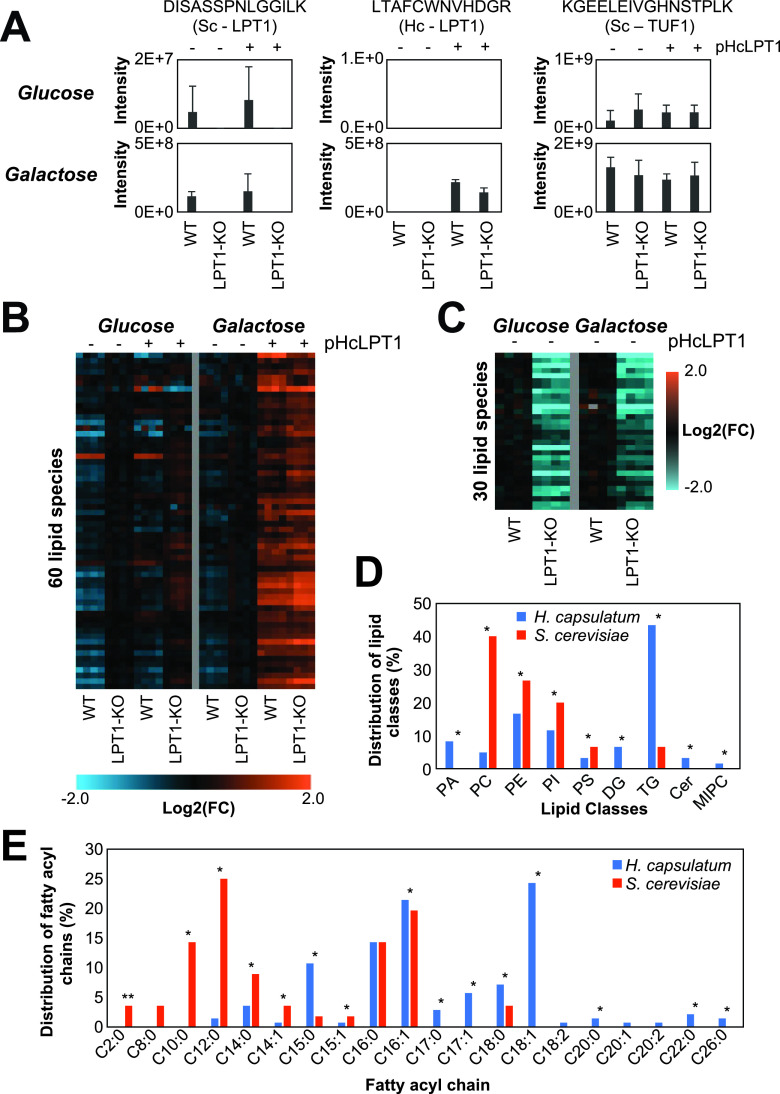
FIG 3.
Analysis of Saccharomyces cerevisiae (Sc) and Histoplasma capsulatum (Hc) lysophospholipid acetyltransferase LPT1 genes. The analysis was done in wild-type and LPT1-knockout (KO) (Lpt1−/−) S. cerevisiae strains complemented or not with the pESC-URA plasmid with the Hc-LPT1 gene under a galactose-inducible promoter. S. cerevisiae WT and LPT1-knockout (KO) strains were grown in YNB medium supplemented with glucose (Glc) or galactose (Gal). (A) Protein abundance of Sc and Hc LPT1 proteins measured by the intensity of specific peptides in the LC-MS/MS analysis. Elongation factor Tu (TUF1) was used as a loading control. As expected, Sc LPT1 was only detected in the WT strain, whereas Hc LPT1 was detected only in strains transformed with the plasmid and induced with galactose. (B and C) Heatmaps of identified HcLPT1 (B) and ScLPT1 (C) products (P ≤ 0.05) compared to the complemented versus control strains (B) or LPT1-KO versus WT strains (C). The experiments were done in two independent batches delimited by the vertical gray lines. (D and E) Distribution of the lipid classes (D) and fatty acyl groups (E) of the HcLPT1 and ScLPT1 products. *, P ≤ 0.05 by Fisher’s exact test.

