
FIG 5.
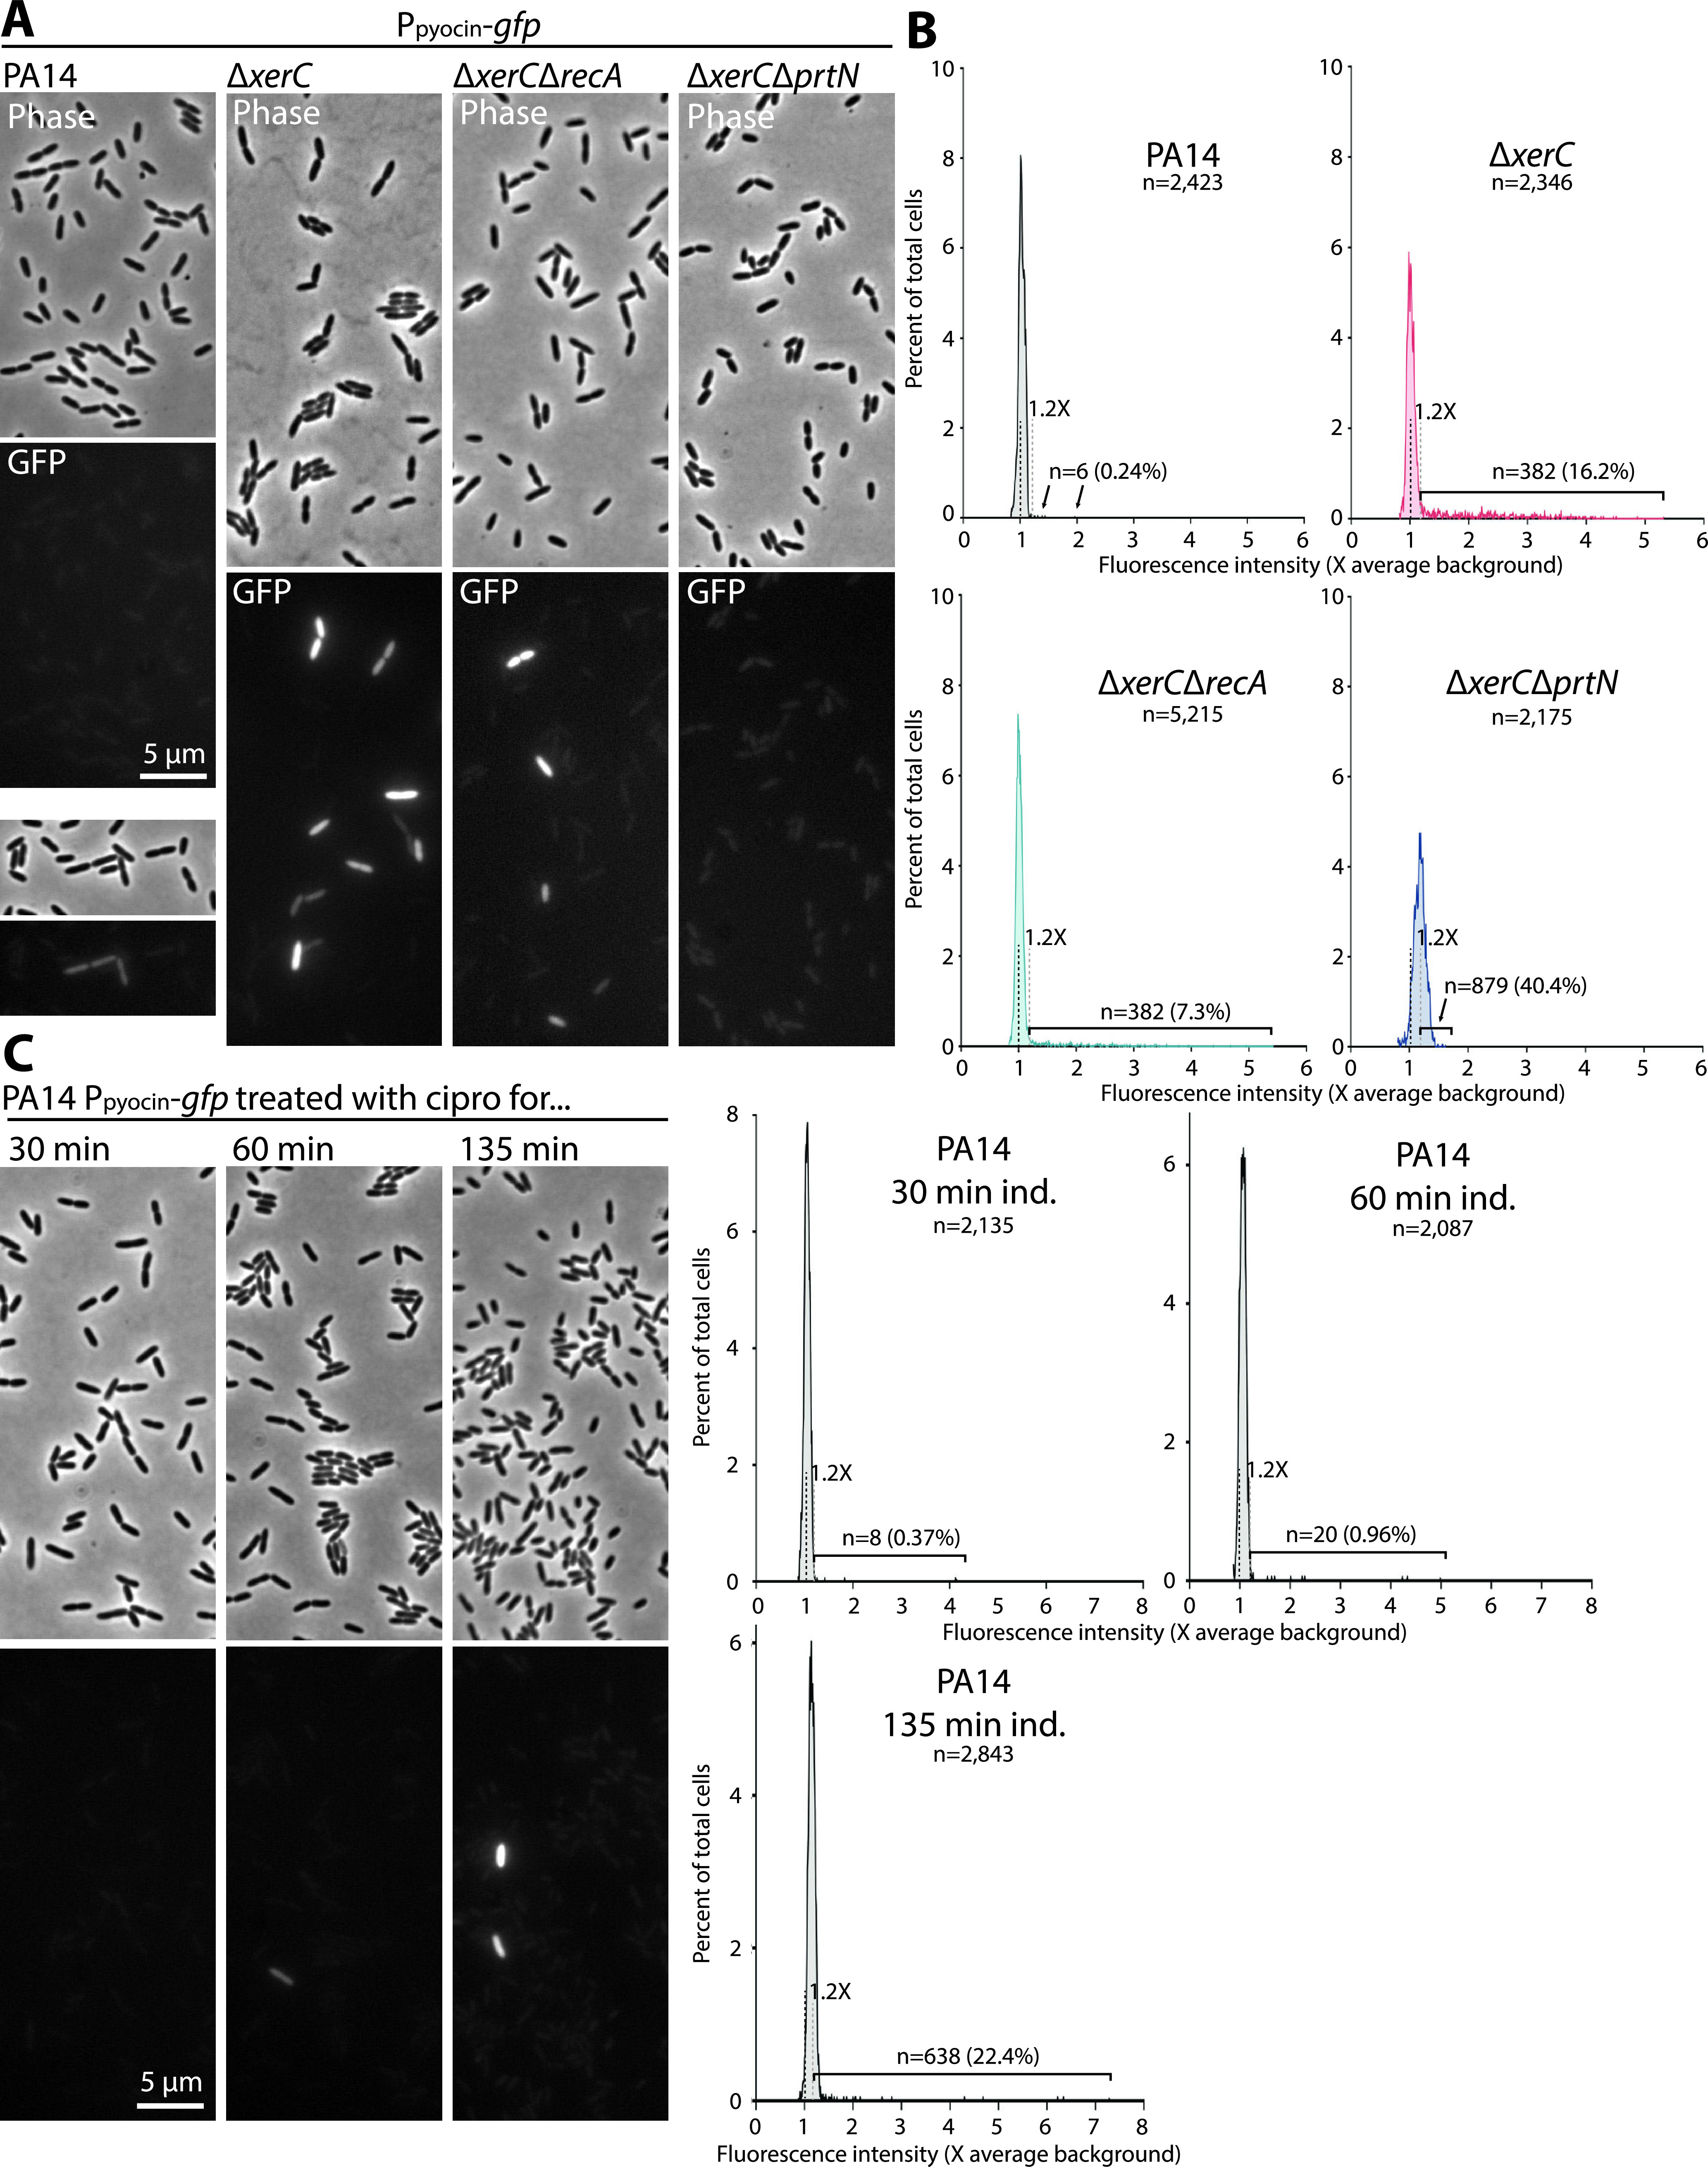
Pyocin expression is heterogeneous across individual cells. (A) Representative phase-contrast and fluorescence micrographs of PA14 (MTC2277), ΔxerC (MTC2252), ΔxerC ΔrecA (MTC2291), and ΔxerC ΔprtN (MTC2292) cells growing on agarose pads. (B) Line histograms of average GFP fluorescence in individual cells of the indicated strains. Fluorescence is plotted as a multiple of the average background value, which is indicated with a black dashed line. The gray dashed line represents 1.2× the average background value, which was set as the threshold for GFP positivity (see Materials and Methods and Fig. S2). The numbers and percentages of positive cells are indicated. (C) Representative micrographs of PA14 pyocin-reporter cells treated in liquid culture for the indicated times with 1 μg/mL ciprofloxacin. (D) Line histograms of GFP mean fluorescence in individual cells of the indicated strains. Annotations are as in panel B.