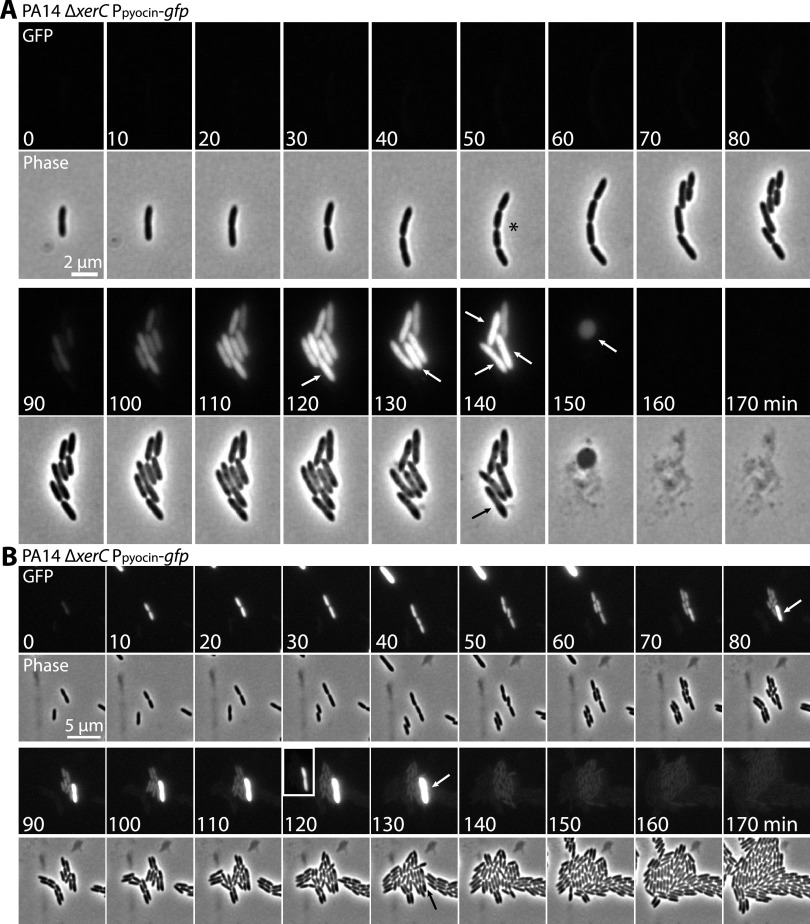
FIG 7.
Fate of cells that turn on pyocin expression. (A) Time-lapse series of fluorescence (GFP) and phase micrographs of PA14 ΔxerC cells bearing a P07990-gfp reporter at attB (MTC2252) to report on R/F pyocin expression. Asterisk indicates chained cells. White arrows denote cells that lysed before the next time point. Black arrow indicates a cell that showed no GFP expression but that lysed with the other cells in the microcolony. (B) Time-lapse series as in panel A showing both a cell that strongly expressed GFP and lysed (white arrows) and cells that initially weakly expressed GFP but then appeared to turn off pyocin expression and continue growing. Inset (120 min): Image rescaled to show the relative weakness of GFP expression in cells that turned pyocin expression off compared to the strong expression of the cell that lysed.

