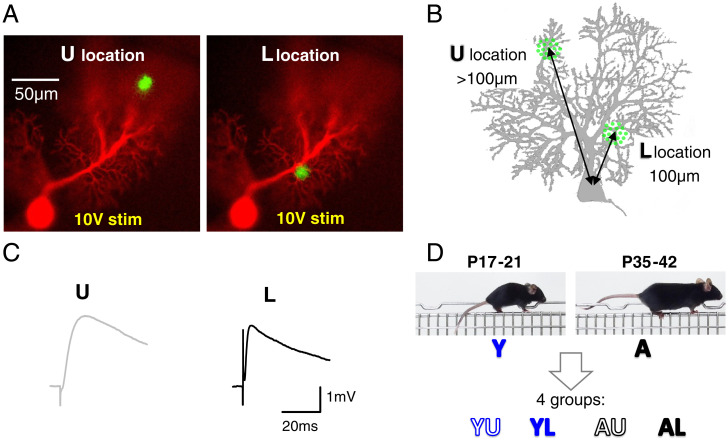
Fig. 1.
Experimental protocol outline. (A) Images of a patch-clamp-recorded PC loaded with morphological marker Alexa 594 superimposed to the GCaMP6f-mediated ΔF/F response to stimulation in PFs. Two locations were examined: in the middle of the upper (U) or lower (L) half of the molecular layer. (B) Schematic PC showing how the U and L locations were measured relative to the PC soma. (C) EPSPs evoked by a 10-V × 100-µs stimulation pulse at the U or L loci shown in A. (D) Definition of the four groups of data considered, depending on the mouse age (Y or A) and the location of the stimulation (U or L).

