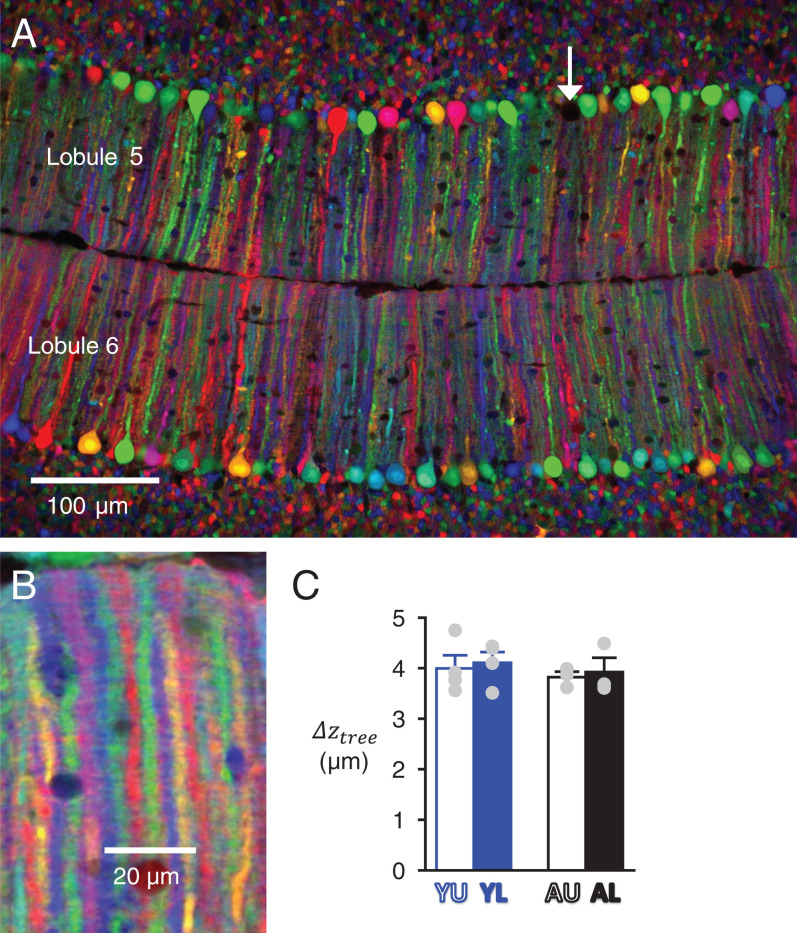
Fig. 3.
Determination of the spacing between adjacent PC dendritic trees. (A) Confocal image of lobules 5 and 6 in a horizontal slice from a Y-stage Wnt1-Cre;CAG-Cytbow mouse. Recombination has occurred in almost all PCs; the arrow points at a rare unlabeled PC. (B) High-magnification view of PC dendrites with averaging of a series of optical plans over 6 µm enabling unambiguous measure of the spacing between successive planar PC trees along the transverse axis (). (C) Average for the four groups of data.

