Fig. 4.
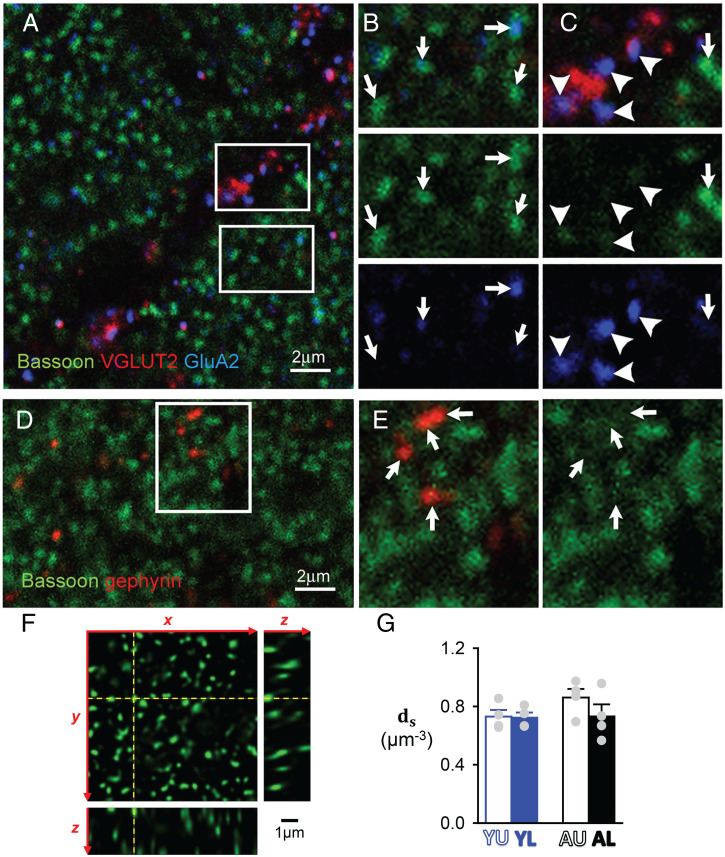
Determination of GC-to-PC synapse density ds by immunocytochemistry. (A) GC-to-PC synapses in the molecular layer identified by punctate bassoon labeling (green). VGLUT2 labeling (red) was performed in conjunction with AMPA receptor labeling (GluA2, blue) to identify climbing fibers (CF) synapses. (B) Inset from A showing GluA2 immunolabeling (blue) apposed to bassoon immunoreactive puncta at PF-to-PC synapses (indicated by arrows). Note that the intensity of GluA2 labeling was highly variable across bassoon puncta. (C) Inset from A showing that bassoon expression at CF-to-PC synapses (arrowheads) was low and easily distinguishable from the intense labeling occurring at GC-to-PC synapses. (D) Inhibitory synapses identified by gephyrin immunoreactivity in the molecular layer. (E) Inset showing that bassoon expression was either low or absent at these inhibitory synapses. (F) Three-dimensional view of a deconvolved optical section stack used for GC-to-PC synapses counting. The y–z and the x–z images correspond to the yellow dashed lines on the x–y image. Note that bassoon puncta were well-resolved, allowing individual counting of GC-to-PC synapses. (G) Average ds for the four groups of data.

