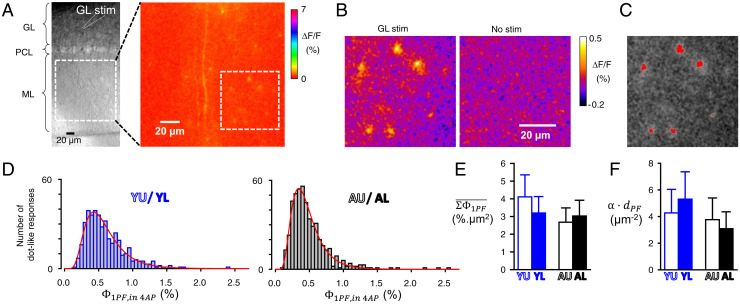
Fig. 5.
Determination of the average GCaMP6f-mediated ΔF/F response produced by a single activated PF in order to calculate the areal density of functional PFs. (A) (Left) Transmitted light image of a superfused sagittal cerebellar slice showing the position of a stimulation electrode in the granular layer relative to the field of view in the molecular layer for which the ΔF/F image following stimulation in the granular layer is displayed (Right). In the presence of 50 µM 4AP to enhance the ΔF/F responses (see SI Appendix, data). (B) Zoom of the part of the ML delimited by a dotted square in A, Right, with a ΔF/F scale enabling unambiguous detection of spot-like ΔF/F responses (not present in the absence of stimulation: Right). (C) Thresholding for identification of spot-like ΔF/F responses (6 responses on this image). Their peak values () were determined as detailed in SI Appendix, Fig. S7. (D) Distribution of for data from Y and A mice (data from individual groups, with spot-like ΔF/F responses attributed to U or L loci according to their distance from the PC soma closest to the stimulating electrode, are shown in Table 1). (E) Average values calculated from values (see SI Appendix, Supplementary Information Text) for the four groups of data. (F) Average (areal density of functional PFs) calculated from and according to Eq. 5. Calculations with error propagation.

