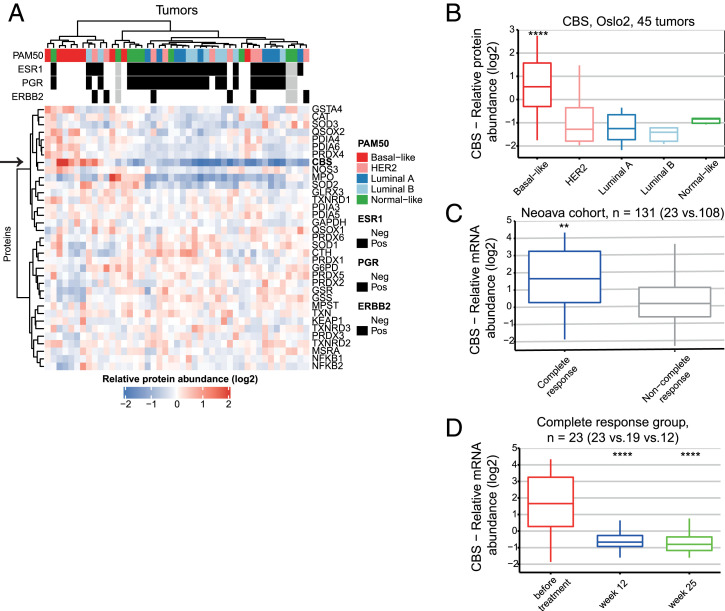
Fig. 1.
CBS is expressed at high levels in BLBC. (A) Clustering of redox proteins using high-resolution isoelectric focusing quantitative proteomics analysis of 45 breast cancer samples from the Oslo2 cohort. Arrow indicates the protein abundance levels of CBS. Pearson correlation, Ward D2 was used for clustering. (B) Boxplot of CBS protein levels in PAM50 subgroups. Quantitation based on in-depth proteomics data, and statistical analysis was performed using DEqMS (basal-like group compared to the rest of the samples). (C) CBS mRNA expression levels in treatment-naïve breast tumors subsequently showing complete response versus noncomplete response to treatment in the NeoAva cohort (both treatment arms combined). (D) Changes in CBS mRNA expression levels in response to 12 and 25 wk of treatment in complete responders (both treatment arms combined). **P < 0.01 and ****P < 0.0001. In D, time points are compared to levels before treatment.

