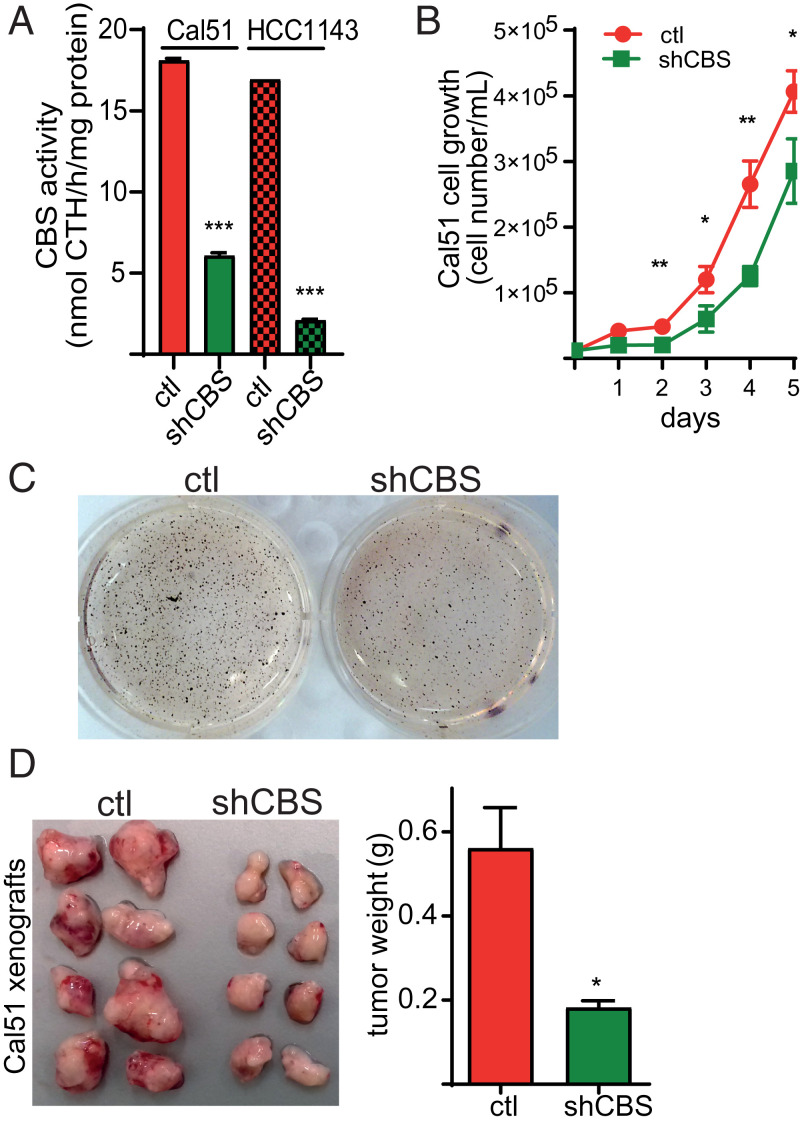
Fig. 2.
(A) After stable mRNA silencing, CBS activities in Cal51 and HCC1143 control and shCBS cell lysates were measured by a liquid chromatography–tandem mass spectrometry–based method using the EZ:faast kit. The data are means ± SD (n = 3). (B) Cal51 cell proliferation in control and shCBS cells were measured daily by cell counting in 6-well plates until they reached full confluency. The data are means ± SD (n = 4). (C) Anchorage-independent growth of HCC1143 control and shCBS cells were measured by a soft agar colony assay. Colonies were visualized with nitroblue tetrazolium sodium salt solution staining after 35 d. Picture of wells are representative of three independent samples. (D) Cal51 control and shCBS cells were injected into SCID female mice subcutaneously. Xenograft tumors were removed when control tissue volumes reached ∼100 mm3. After dissection, xenograft tissues were weighted and photographed. The data are means ± SD (n = 8). *P < 0.05, **P < 0.01, and ***P < 0.001 show significant differences in shCBS compared to control samples in each relevant panel. Experiments were repeated at least three times, and representative images are shown.

