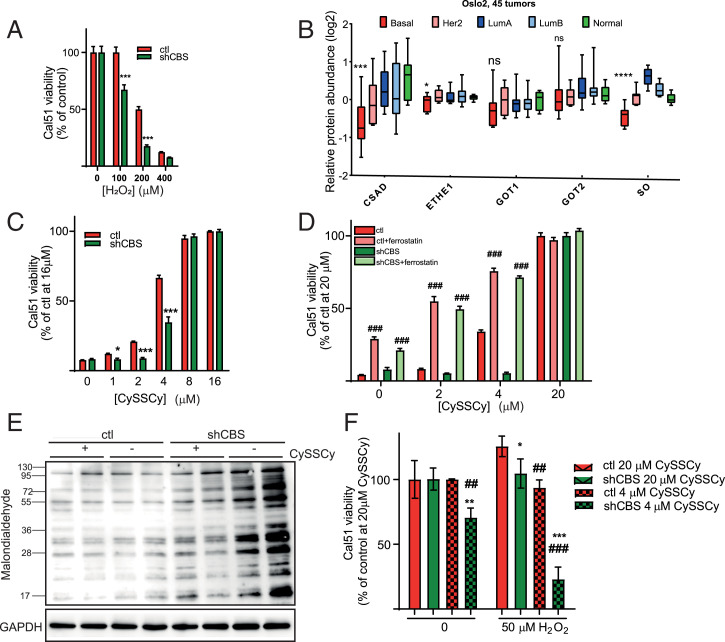
Fig. 4.
CBS protects BLBC tumors from oxidative stress and ferroptotic cell death. (A) Cellular viability of control and shCBS Cal51 cells as measured with the CCK8 method in which cells were treated with increasing concentrations of hydrogen peroxide for 24 h. Viability was evaluated in percentages by considering nontreated control samples as 100%. ***P < 0.001 show significant differences in shCBS compared to control samples. Data are means ± SD (n = 6). (B) Protein levels of transsulfuration enzymes in 45 breast tumors of the Oslo 2 proteomics cohort. For each enzyme, basal subtypes are compared to all other subtypes using DEqMS. ns: P ≥ 0.05, ****P < 0.0001. (C) Viability of control and shCBS Cal51 cells as measured by the Sulforhodamine B (SRB) method in which cells were maintained in increasing concentrations (0 to 16 µM) of CySSCy for 72 h. Control cells at 16 µM CySSCy were considered as 100% of survival. *P < 0.05, **P < 0.01, and ***P < 0.001 show significant differences in shCBS compared to control. The data are means ± SD (n = 4). (D) Cellular viability was measured with the SRB method for control and shCBS Cal51 cells, which were maintained in increasing concentrations (0 to 20 µM) of CySSCy in the presence or absence of 1 µM ferrostatin for 72 h. ###P < 0.001 show significant differences between nontreated and ferrostatin-treated control or shCBS cells. The data are means ± SD (n = 4). (E) Cal51 control and shCBS cells were maintained in normal and CySSCy-free media for 48 h. Western blot analyses were performed using a lipid peroxide marker anti-malondialdehyde antibody. Image is representative of two biological replicates. (F) Control and shCBS Cal51 cells were conditioned in 4 and 20 µM CySSCy for 24 h followed by 0 or 50 μM hydrogen peroxide treatment for 24 h. Viability was measured by the CCK8 method. Survival in nontreated cells with 20 µM CySSCy were set as 100%. *P < 0.05, **P < 0.01, and ***P < 0.001 show significant differences in shCBS compared to control cells. ##P < 0.01 and ###P < 0.001 show significant differences between cells which were maintained in 20 µM and 4 µM CySSCy. The data are means ± SD (n = 6). Experiments were repeated three times, and representative images are shown.

