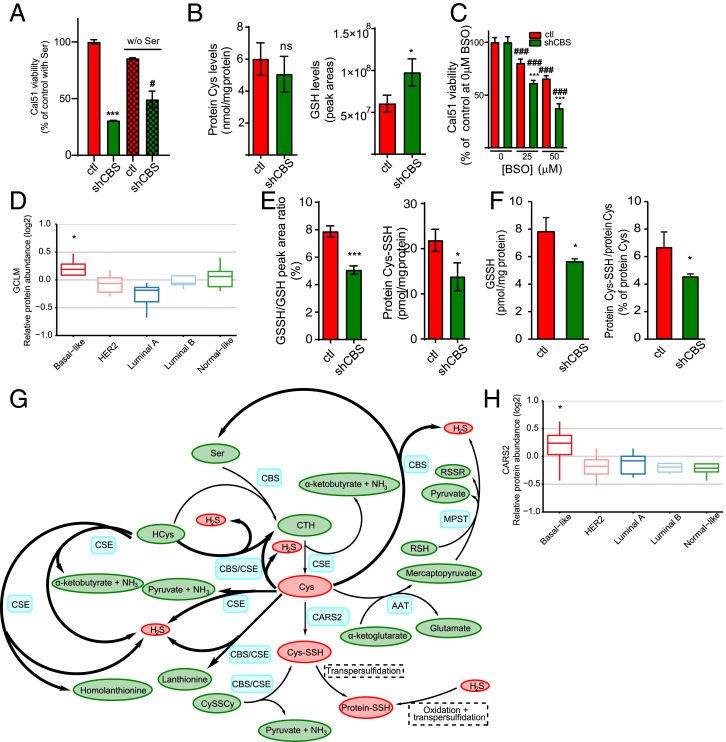
Fig. 5.
CBS-dependent protein-Cys persulfidation contributes to protection against oxidative stress in BLBC cells. (A) Viability of control and shCBS Cal51 cells as measured by the Sulforhodamine B (SRB) method in which cells were maintained in 4 µM CySSCy in the presence or absence of 250 µM serine for 72 h. Results are presented in percentage in which the viability of control cells in 250 µM serine were set as 100%. ***P < 0.001 shows significant differences in viability of shCBS compared to control cells. #P < 0.05 shows significant differences between serine-deprived and nondeprived conditions. The data are means ± SD (n = 6). (B) Levels of protein incorporated Cys content and intracellular GSH in control and shCBS Cal51 cells in which cells were maintained in 4 µM CySSCy for 48 h followed by β-(4-hydroxyphenyl)ethyl iodoacetamide (HPE-IAM) labeling and liquid chromatography–tandem mass spectrometry (HPLC-MS/MS) analyses. The data are means ± SD (n = 3). ns: P ≥ 0.05 and *P < 0.05 shows a significant difference in control compared to shCBS cells. (C) Cellular viability measured by the SRB method in Cal51 control and shCBS cells in which cells were treated with increasing concentrations of the GCLM inhibitor BSO for 72 h. Viabilities of nontreated cells were set as 100%. ###P < 0.001 shows significant differences in BSO-treated compared to the corresponding nontreated samples. ***P < 0.001 shows significant differences in shCBS compared to control cells. The data are means ± SD (n = 6). (D) Protein levels of human GCLM in different PAM50 subtypes of 45 breast tumors from the Oslo 2 cohort. Basal subtype is compared to all other subtypes, *P < 0.05. (E) Levels of protein and GSH Cys persulfidation were analyzed using HPLC-MS/MS in Cal51 control and shCBS cells, which were cultured in 4 µM CySSCy for 48 h and labeled with HPE-IAM. GSSH/GSH represents the percentage of GSH persulfide to GSH calculated from peak areas (Left). Protein-Cys–SSH represents the amount of persulfidated Cys incorporated in the total proteome (Right). The data are means ± SD (n =3). *P < 0.05, and ***P < 0.001 show significant differences in shCBS compared to control cells. (F) GSSH (Left) and protein-Cys polysulfidation (Right) levels in Cal51 control and shCBS tumor xenografts were measured by HPLC-MS/MS. *P < 0.05 shows significant differences in shCBS compared to control tumors. The data are means ± SD (n =3). (G) Schematic representation of H2S and persulfide production from endogenous Cys. Blue denotes enzymes, yellow denotes metabolites, red indicates the sulfur containing metabolites that play central roles in persulfidation, and bold arrows indicate the H2S-producing processes of CBS and CSE. AAT: aspartate aminotransferase, MPST: 3-mercaptopyruvate sulfurtransferase, CTH: Cystathionine, Cys-SSH: Cysteine-persulfide, Protein-SSH: protein with persulfidated Cys, RSH: reduced thiol, RSSR: oxidized thiol, Ser: serine, HCys: homocysteine, CySSCy: cystine. (H) CARS2 protein levels in PAM50 subtypes of 45 breast tumors from the Oslo 2 cohort. The basal-like subtype is compared to all other subtypes, *P < 0.05. All experiments were repeated at least three times, and representative images are shown.

