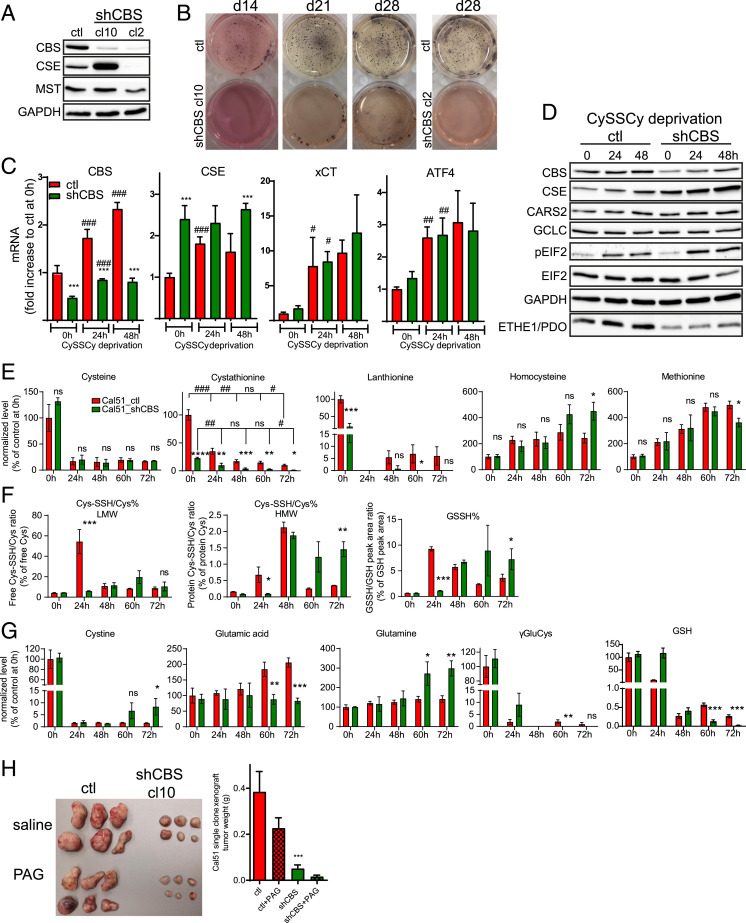
Fig. 6.
CSE can compensate to some extent for the effects of CBS knockdown, but targeting both enzymes is lethal for BLBC tumors. (A) Expression levels of CBS, CSE, and MPST is shown by Western blot in Cal51 shCBS single-clone cells (cl10 and cl2). (B) Anchorage-independent growth of Cal51 control and shCBS single-clone cells were measured by a soft agar colony assay. Colonies were visualized after 14, 21, and 28 d with nitroblue tetrazolium sodium salt solution staining. No colonies were detected in Cal51 shCBS single-clone 2 which failed to overexpress CSE. (C) RT-qPCR analysis of CBS, CSE, ATF4, and xCT (SLC7A11) in Cal51 control and shCBS single-clone cells after 0, 24, and 48 h of CySSCy deprivation. Actin, GAPDH, and β2M were used as housekeeping genes. *P < 0.05, **P < 0.01, and ***P < 0.001 show significant differences in shCBS compared to control cells. #P < 0.05, ##P < 0.01, and ###P < 0.001 show significant differences in time points compared to the previous time points in the same cell type. The data are means ± SD (n = 4). (D) Western blot analyses of CBS, CSE, CARS2, GCLC, eIF2, pEIF2, ETHE1/PDO from control and shCBS single-clone cells after 24 and 48 h of CySSCy deprivation. (E–G) Metabolite analyses using the EZ:faast kit (Cys, cystathionine [CTH], HCys, Met, Lanth, CySSCy, Glu, GLN, gGluCys) or the β-(4-hydroxyphenyl)ethyl iodoacetamide (HPE-IAM) labeling based liquid chromatography–tandem mass spectrometry (HPLC/MS-MS) method (Cys-SSH/Cys% HMW, Cys-SSH/Cys% LMW, GSSH%, GSSH LMW) in Cal51 control and shCBS single-clone cells, which were CySSCy deprived for 24, 48, 60, and 72 h. Cys, CTH, HCys, Met, Lanth, CySSCy, Glu, GLN, and gGluCys levels are presented as percentage of the corresponding control samples at t = 0, which were set as 100%; GSSH% represents the percentage of GSH persulfide to GSH, which were calculated from peak areas; Cys-SSH/Cys% LMW and Cys-SSH/Cys% HMW represents the percentage of Cys persulfide to Cys, which were calculated from their respective concentrations in which LMW refers to free and HMW refers to protein-bound cysteines. ns: P ≥ 0.05, *P < 0.05, **P < 0.01, ***P < 0.001, and ****P < 0.0001 show significant differences in shCBS compared to control samples. #P < 0.05, ##P < 0.01, ###P < 0.001, and ####P < 0.0001 show significant differences in timepoints compared to the previous timepoints in the same cell type. The data are means ± SD (n = 3). (H) Cal51 control and shCBS single clones were injected in female SCID mice subcutaneously. Mice received PAG or saline at 50 mg per body weight (kg) twice a week. After termination, xenograft tissues were removed, photographed, and weighted. ***P < 0.001 show significant differences in shCBS compared to control tumors. All experiments were repeated at least three times, and representative images are shown.

