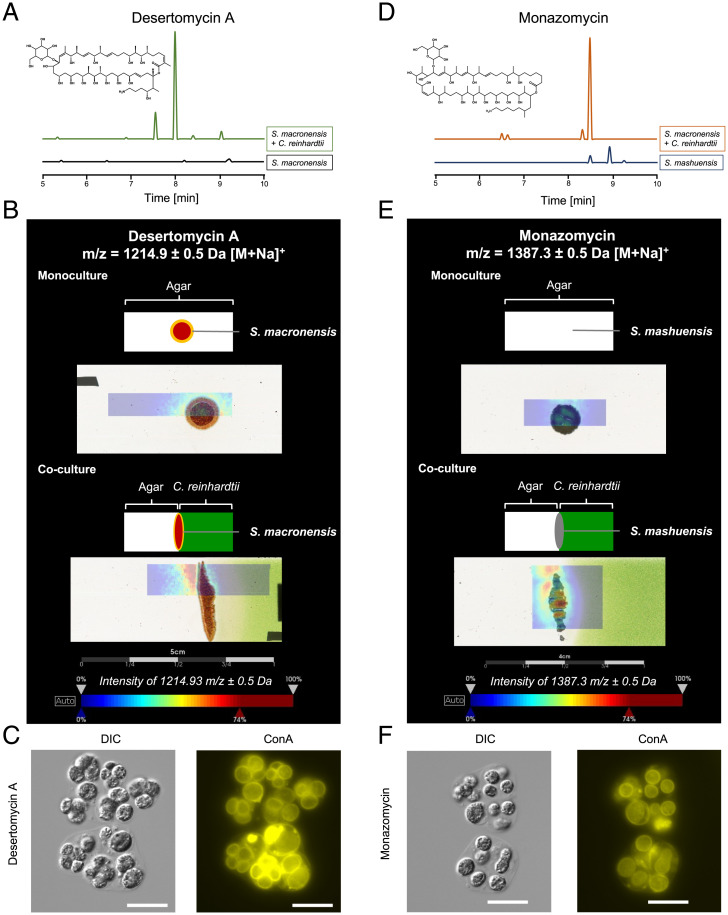
Fig. 3.
Desertomycin A and monazomycin are overproduced by steptomycetes in coculture with C. reinhardtii, colocalize with C. reinhardtii killing zone on solid medium, and induce gloeocapsoid formation. (A) Extracted ion chromatogram of an extract of a coculture of C. reinhardtii with S. macronensis in liquid culture compared with a monoculture of the streptomycete. m/z 1,191.2 to 1,192.2 [M – H]– corresponding to desertomycin A. (B) Matrix-assisted laser desorption/ionization imaging mass spectrometry (MALDI-IMS) for desertomycin A. The microorganisms were grown directly on the object slide. The top picture of the mono- and the coculture represents a schematic overview of the position of the bacterial colony on TAP agar (monoculture) or on a split agar containing C. reinhardtii only in the right agar half (coculture). The bottom pictures show the overlays of the MALDI-IMS image indicating the color-coded abundance of ion m/z 1,214.9 ± 0.5 Da (desertomycin A, [M + Na]+) and the actual culture. (C) C. reinhardtii treated with 1.5 μg ⋅ mL−1 desertomycin A forms gloeocapsoids. (Scale bars: 20 μm.) (D) Extracted ion chromatogram of an extract of a coculture of C. reinhardtii with S. mashuensis compared to a monoculture of the streptomycete. Extracted ion chromatogram of m/z 1,363.5 to 1,364.5 [M – H]– corresponding to monazomycin. (E) MALDI-IMS analysis. (Top) S. mashuensis colony on axenic TAP agar. (Bottom) S. mashuensis on TAP agar containing C. reinhardtii. MALDI-IMS images indicate color-coded abundance of ion m/z 1,387.3 ± 0.5 Da (monazomycin, [M + Na]+). Color code: blue, low abundance and red, high abundance of ion. Mass spectrometry (MS) spectra of liquid chromatography–MS analyses were compared to an authentical standard for identification. (F) C. reinhardtii treated with 2.5 μg ⋅ mL−1 monazomycin with gloeocapsoid formation. (Scale bars: 20 μm.)

