Fig. 2.
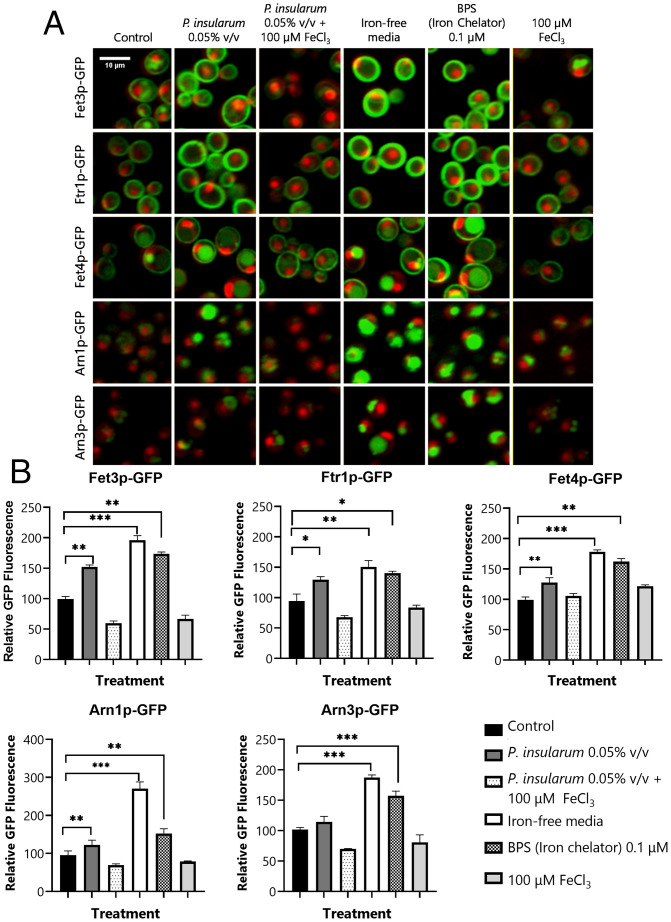
Protein expression levels of iron transporters are highly responsive to the P. insularum homogenate. (A) Protein abundance of iron transporters under control (ddH2O) and treatment conditions (0.05% v/v P. insularum, 0.05% v/v P. insularum homogenate with 100 µM FeCl3 supplementation, iron-free media, 0.1 µM BPS iron chelator, or media supplemented with 100 µM FeCl3) was monitored using confocal fluorescent microscopy analysis of GFP-tagged iron transporters relative to nuclear and cytoplasm markers tagged with high RedStar2 intensity and low-intensity mCherry RFP, respectively. (B) Quantification of GFP fluorescence for each of the five iron transporters across the control and the five treatments. GFP quantification of 300 to 400 cells was achieved using ACAPELLA software version 2.0 (PerkinElmer) that identified cells based on the mCherry and RedStar signals and prescribed the quantification of GFP as previously described (25). Three independent experiments with three technical replicates each were conducted. *P < 0.05; **P < 0.01; ***P < 0.001; Student’s t test comparison to control media.

