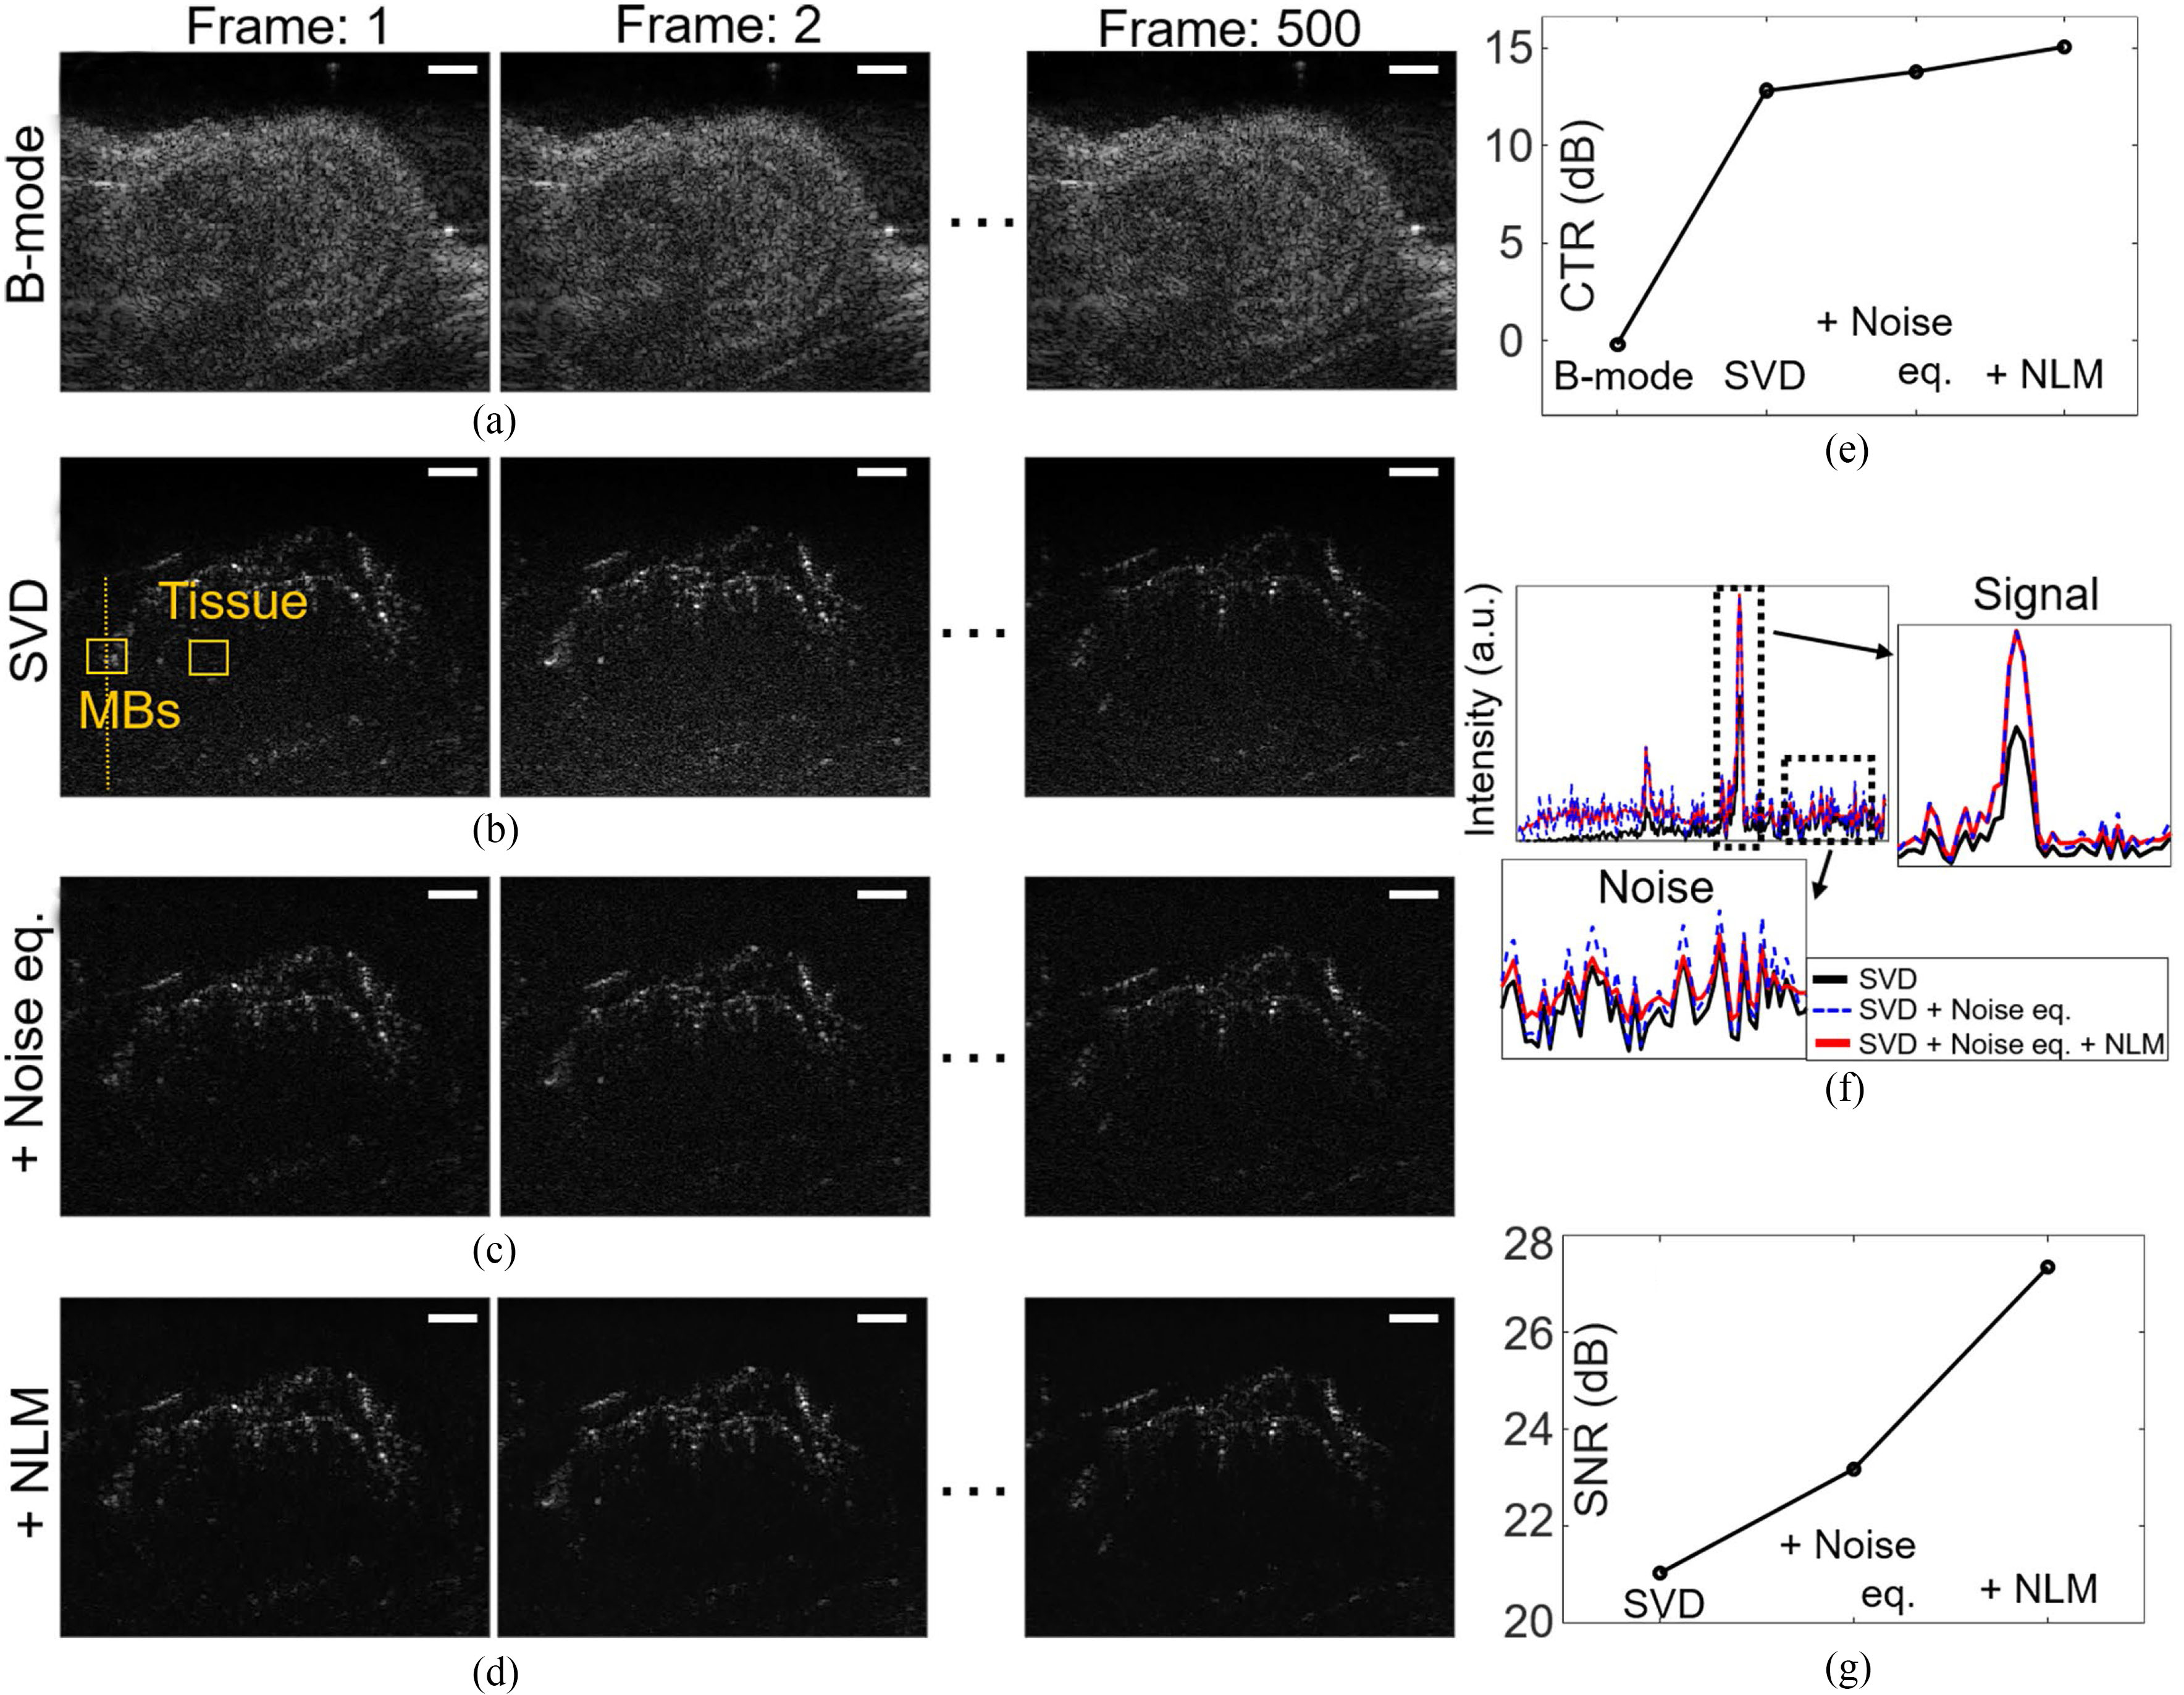
Fig. 4.

Evaluation of combination of post-processing techniques including SVD, noise equalization, and NLM filtering to the data sets acquired by ultrasound imaging of mouse tumor model after MBs injection. (a) B-mode images of frames 1 to 500 are shown. Denoised images after applying post-processing techniques including (b) SVD, (c) Noise equalization, (d) NLM filtering are presented. (e) Comparison of CTR using the acquired signals at the ROIs indicated by the orange boxes in the first frame of (a-d). (f) Intensity profiles along the scan line indicated by orange dotted line in (b-d) shows signal increase without increasing noise level. (g) SNR of images are compared. White scale bars indicate 1 mm.
