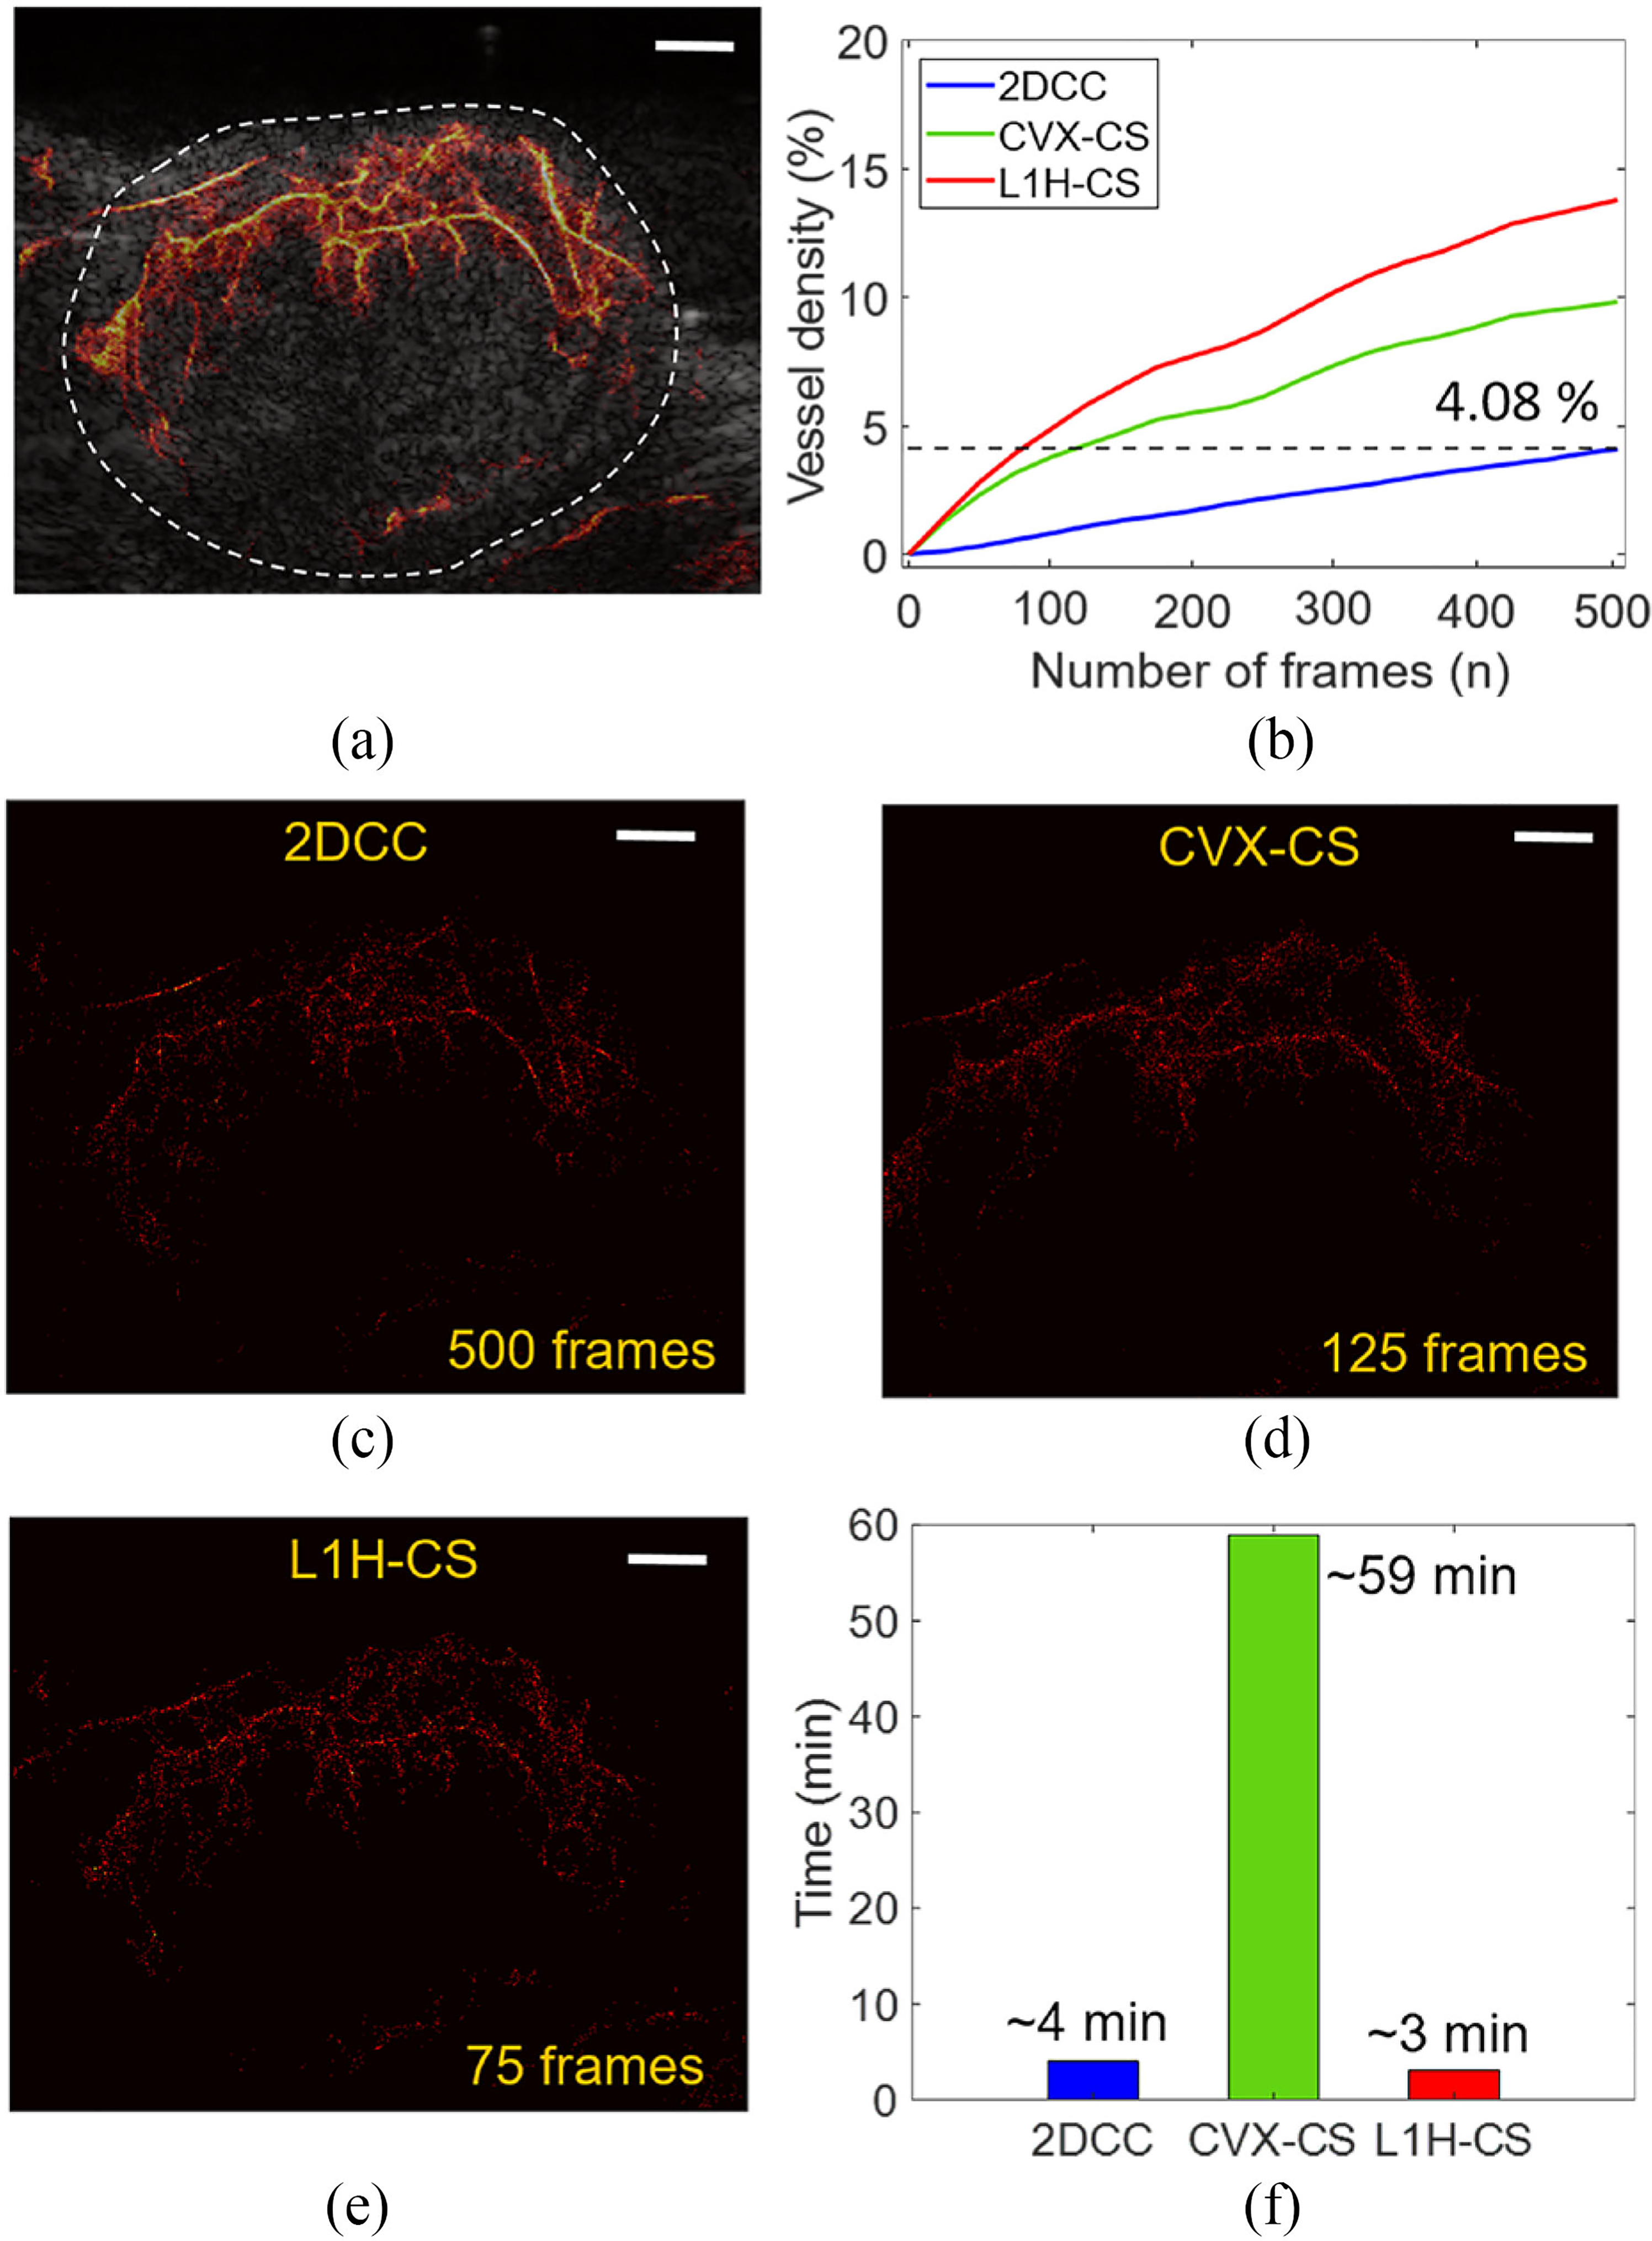
Fig. 6.

Comparison of reconstructed SRUS images of mouse tumor depending on the number of frames. (a) A SRUS image reconstructed by L1H-CS with 500 frames overlaid with B-mode image describes the vasculature inside tumor. (b) VD in the tumor area of SRUS reconstructed by three algorithms were measured depending on the number of frames. (c) SRUS images reconstructed by (c) 2DCC (500 frames), (d) CVX-CS (125 frames), and (e) L1H-CS (75 frames) shows the same VD of 4.08%. (f) Computational time to reconstruct SRUS using 500 frames for 2DCC, 125 frames for CVX-CS, and 75 frames for L1H-CS to reach the same VD. White scale bars indicate 1 mm.
