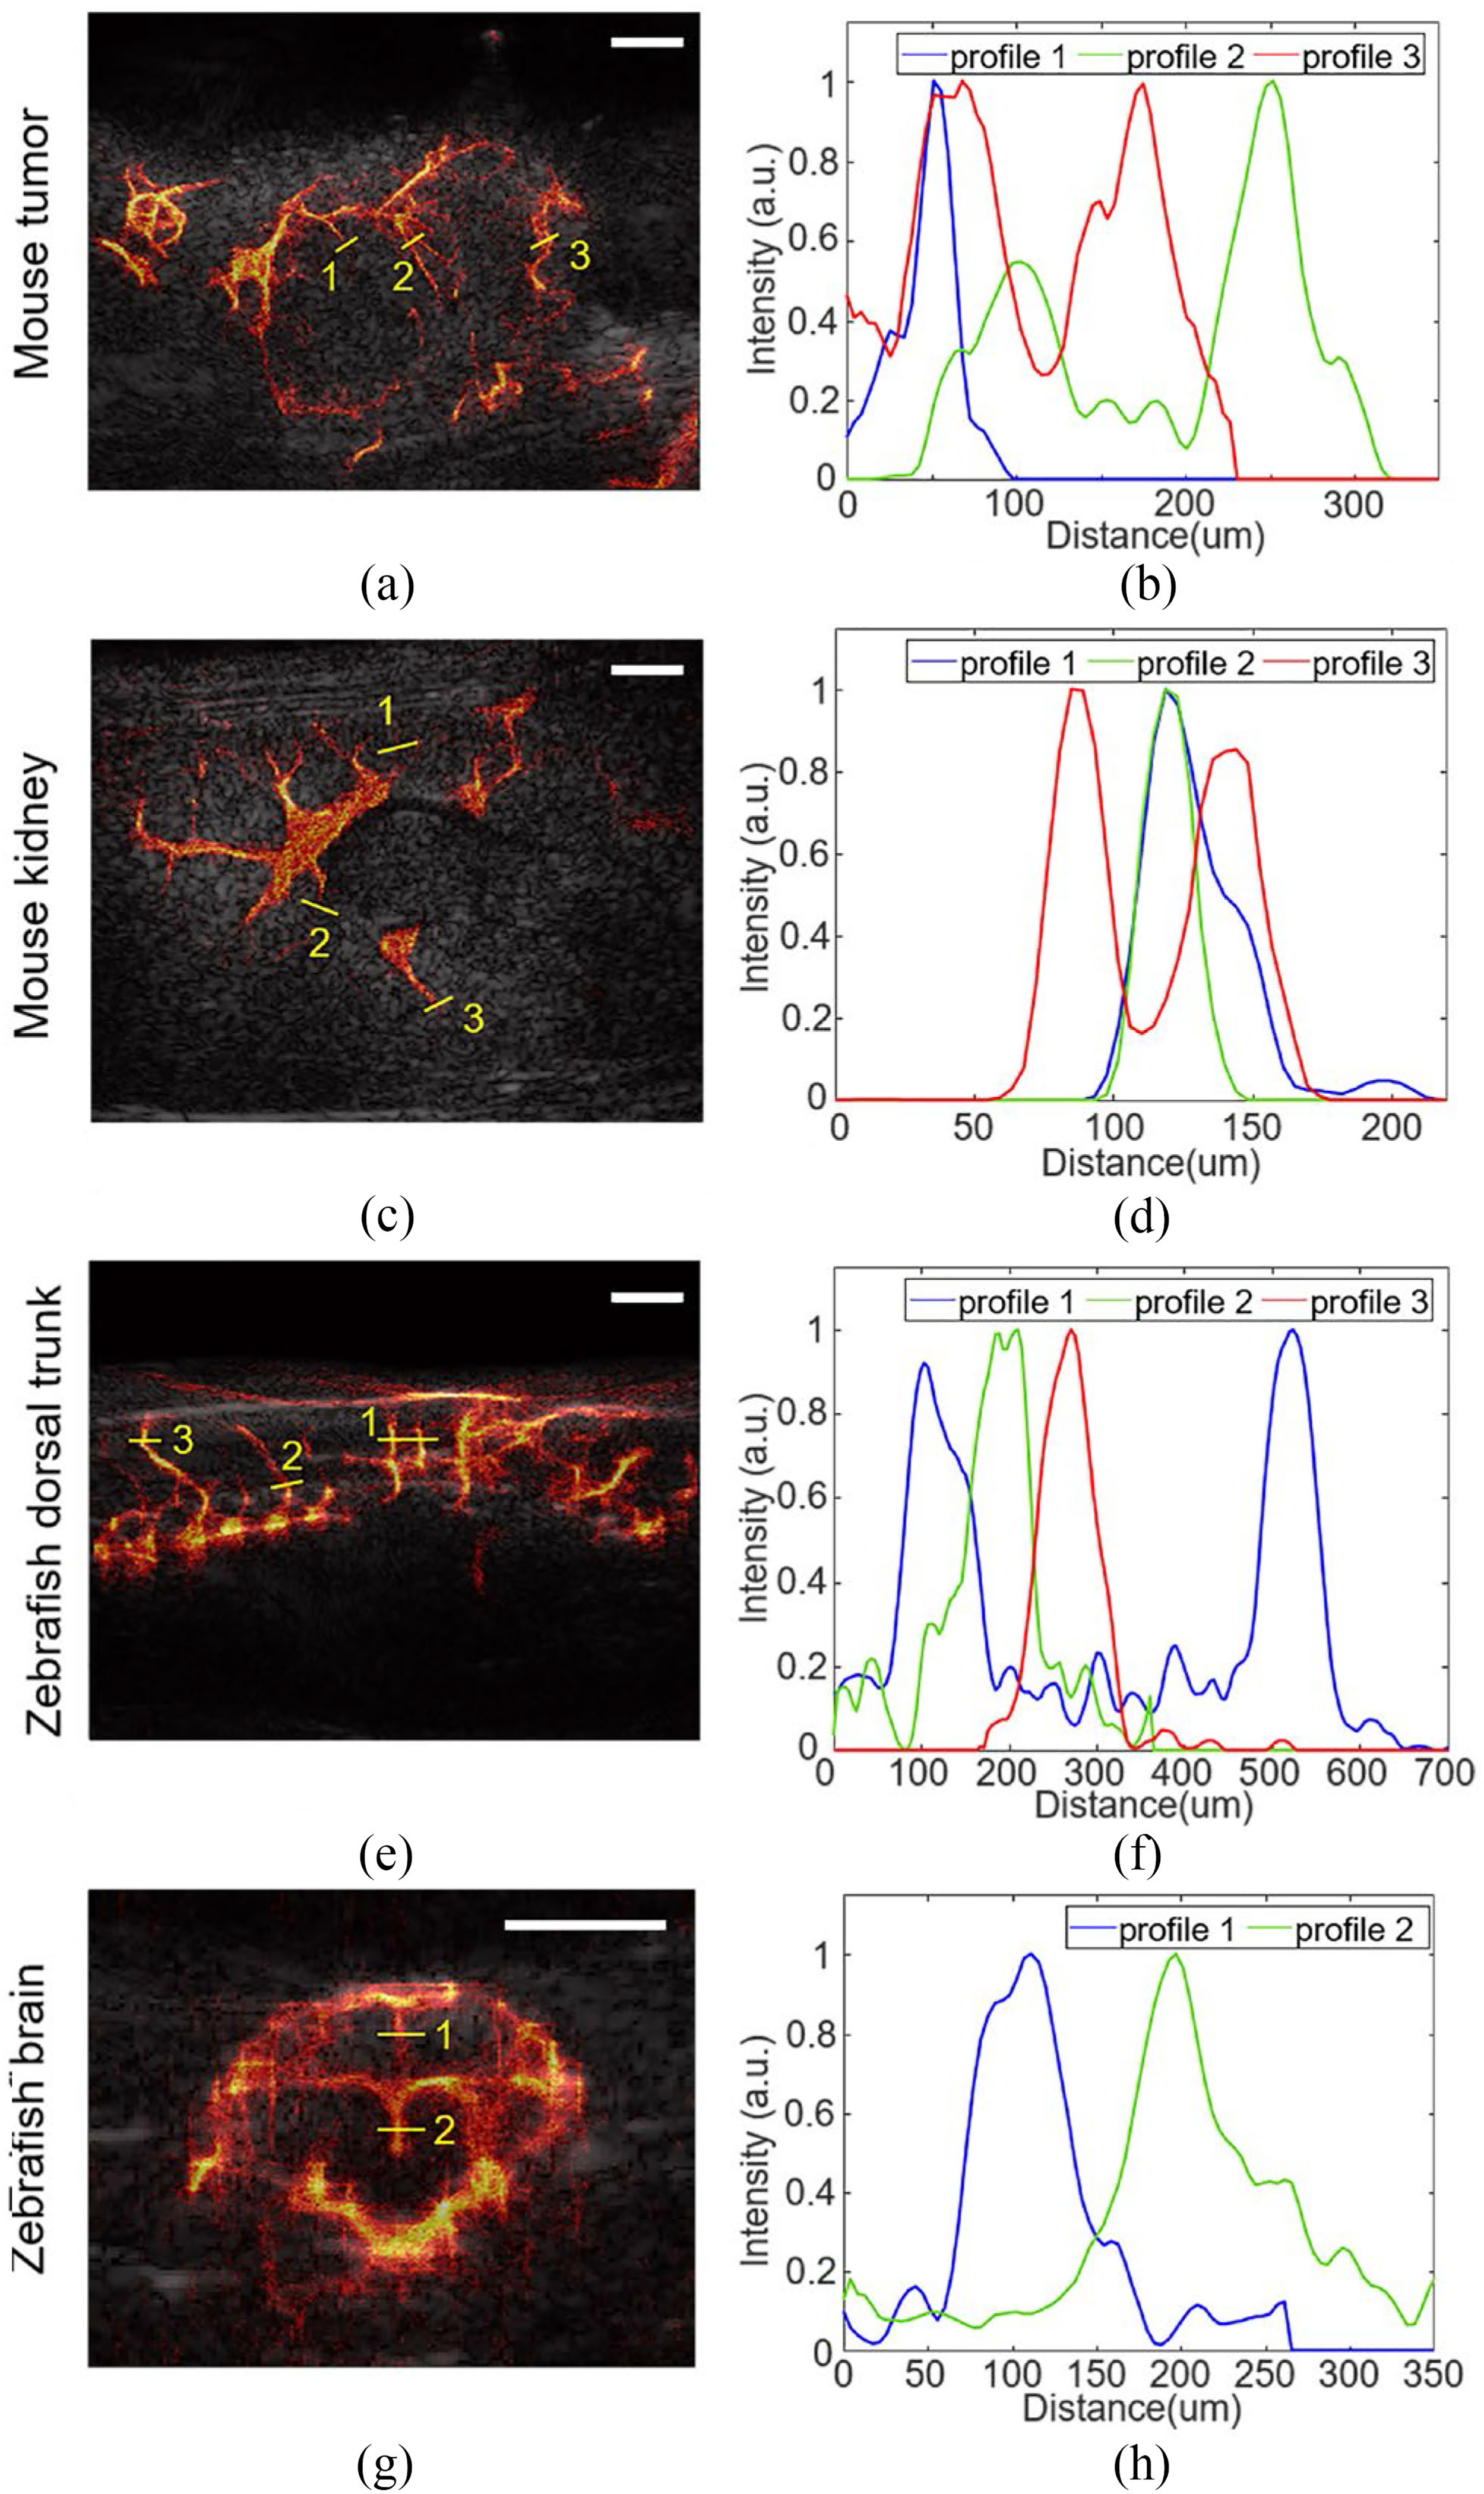
Fig. 7.

Reconstruction of SRUS images overlaid with B-mode images of mouse (a) tumor and (b) kidney and zebrafish (c) dorsal trunk and (d) brain. (e-f) Intensity profiles along the yellow lines indicated in (a-d). The smallest vessel size was measured as 22.2 μm in mouse kidney as shown in profile 2 of (f). Half wavelength of 25 MHz is 32 μm. White scale bars indicate 1 mm.
