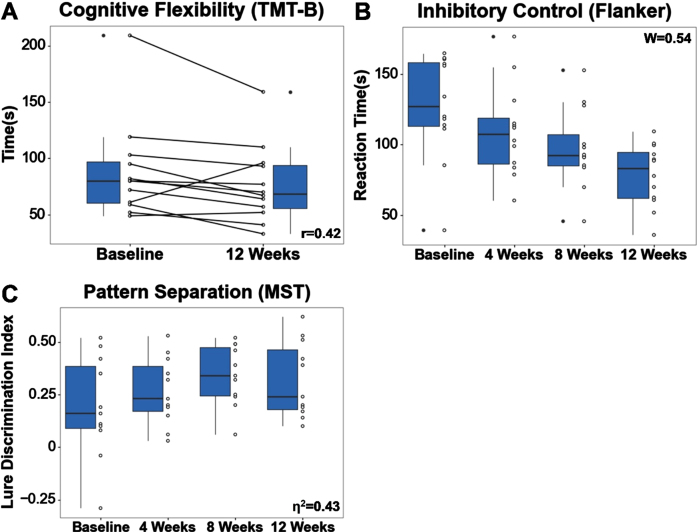
Fig. 4.
(A) Cognitive flexibility, as measured by TMT-B, improved pre- to post-intervention. (B) Inhibitory control, as measured by Flanker, improved across each of the 4 timepoints. (C) Visual discrimination related to pattern separation, as measured by MST, improved pre- to post-intervention. Effect sizes are shown in the bottom or top right corner of each boxplot.

