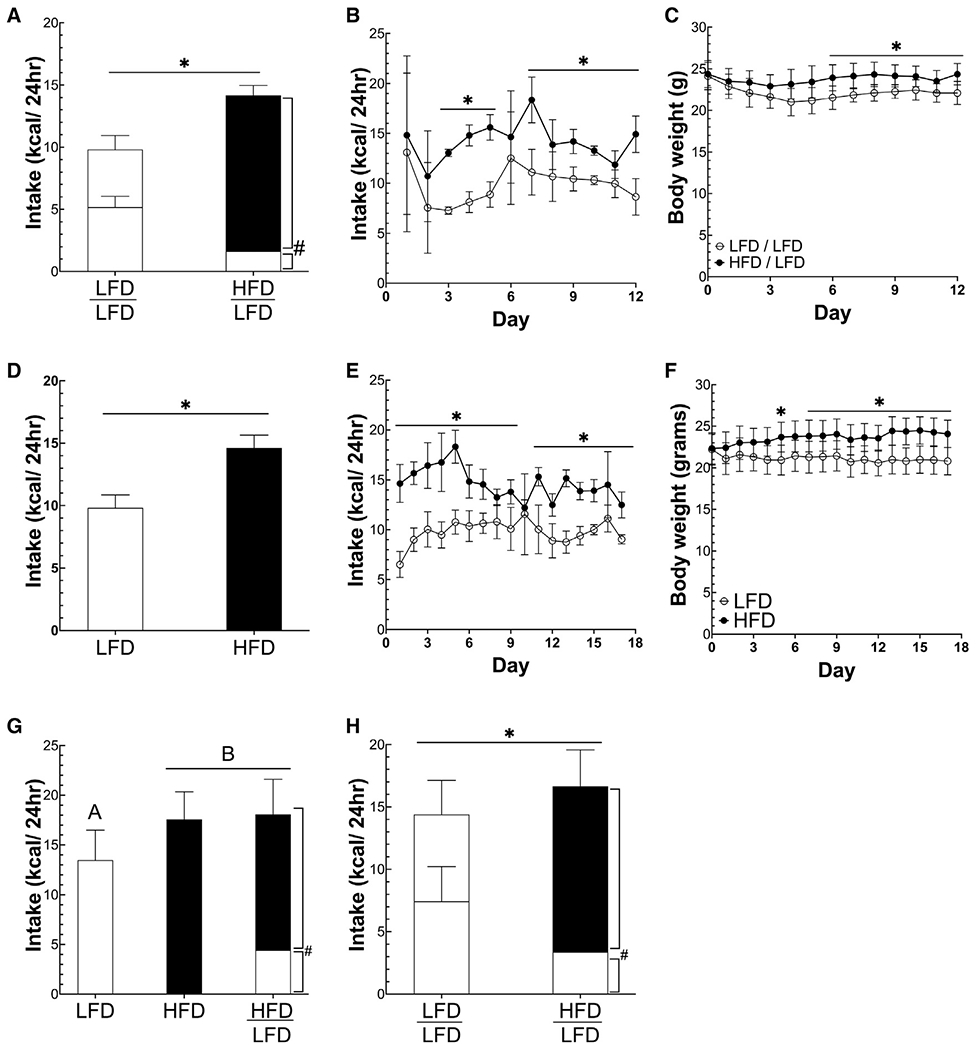
Figure 2. Increasing percent calories from fat increases palatability and intake independent of protein or carbohydrate density.

(A and B) Mean and daily caloric intake of mice offered either a low-fat diet (LFD; 10% of calories from fat) or a high-fat diet (HFD; 60% of calories from fat).
(C) Daily body weight of mice offered either a LFD (10% of calories from fat) or a HFD (60% of calories from fat).
(D and E) Mean and daily caloric intake of mice offered both a LFD and HFD or LFD.
(F) Daily body weight of mice offered both a LFD and HFD or only LFD.
(G) Caloric intake of mice offered either a LFD, HFD, or both HFD and LFD in which carbohydrate content was equal.
(H) Caloric intake of mice offered both a HFD and LFD or only a LFD in which protein content was equal. *p < 0.05 between groups using Student’s t test, #p < 0.05 for diet within-group analyses using a paired t test. Different letters represent significant differences calculated using ANOVA to compare three groups. All data are presented as mean ± standard deviation. n = 5/group. Unshaded bars show LFD intake, and black bars represent HFD intake.
