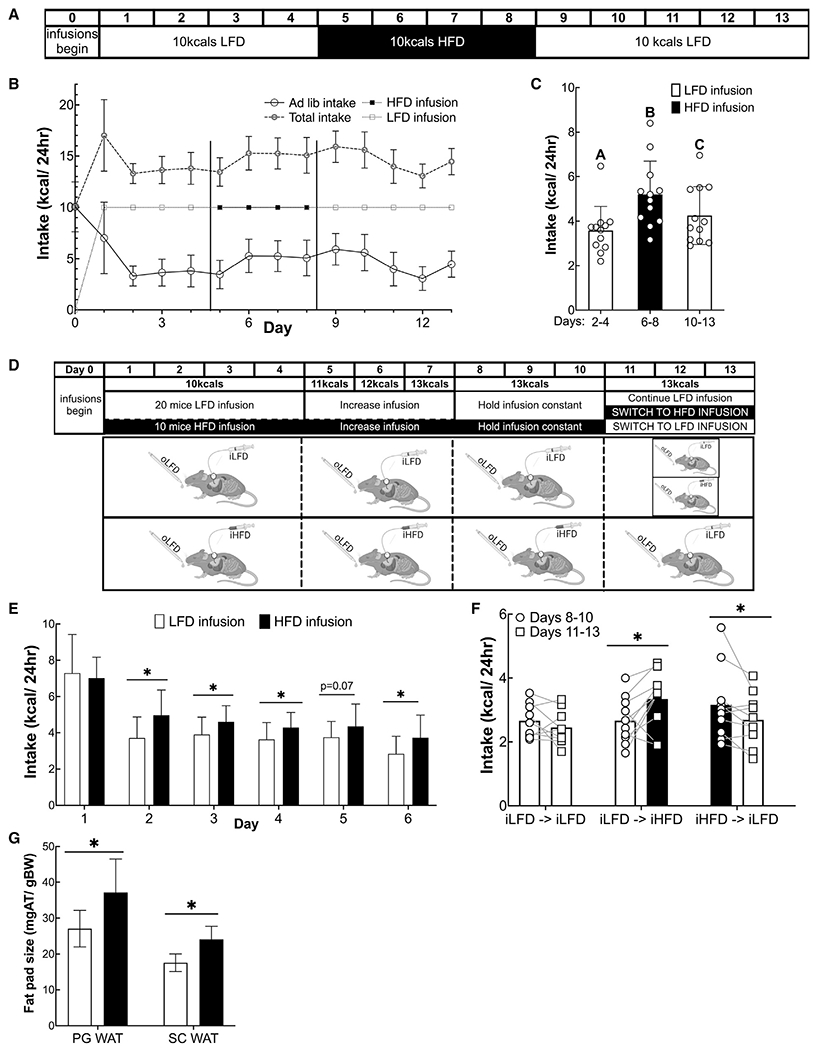
Figure 4. Ad libitum caloric intake is regulated by percent calories from fat of food in the gastrointestinal tract.

(A) Experimental design for data shown in (B) and (C) (n = 14).
(B) Daily ad libitum and infused caloric intake, and total caloric intake. Vertical lines indicate when the infusion diets were switched.
(C) Mean caloric intake during each infusion period excluding the first day of each period to allow for acclimation. Columns represent group averages, and open shapes are individual data points. Data are displayed as mean ± standard deviation. Different letters represent significantly different means as calculated with ANOVA and post hoc t test with a Benjamini-Hochberg correction.
(D) Experimental design for data in (E)–(G) (n = 10–19/group in E and G; and in F, n = 9–10/group). Animals were infused with 10 kcals on days 1–4, and this amount was gradually increased to 13 kcals/day at which it remained for the rest of the experiment. On day 11, infused diets were switched from infused LFD (iLFD) to infused HFD (iHFD) or iHFD to iLFD, and the control group remained on iLFD.
(E) Daily ad libitum intake over days 1–6.
(F) Mean ad libitum intake days 8–10 compared to intake on days 11–13.
(G) Epididymal fat mass as a fraction of total body weight. *p < 0.05 as calculated by Student’s t test in (E) and (G) or paired t test in (F).
