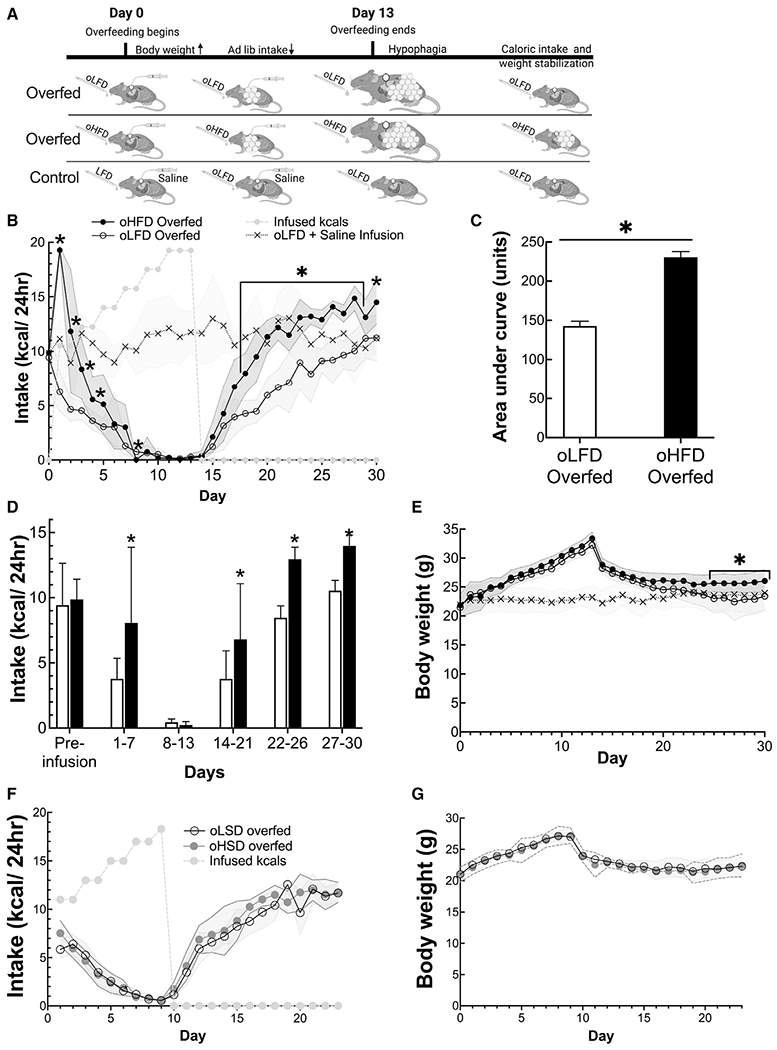
Figure 6. Access to a HFD attenuates defense of body weight.

(A) Experimental design showing the three groups and their ad libitum and infused diets.
(B) Ad libitum caloric intake of overfed and control mice.
(C) Total ad libitum caloric intake is greater in mice offered oHFD than mice offered oLFD as measured as area under the curves.
(D) Ad libitum caloric intake during periods of overfeeding protocol.
(E) Daily body weight of control, oLFD, and oHFD during overfeeding experiment.
(F and G) Ad libitum caloric intake and body weight of mice that were overfed and had ad libitum oral access to low-sweetness diet (oLSD) or ad libitum access to an oral high-sweetness diet (oHSD). Data are presented as mean ± standard deviation shown by either error bars of the shaded regions in the line graphs. *p < 0.05, comparing the LFD and HFD overfed groups using a Student’s t test. Unshaded bars show oLFD intake, and black bars show intake during oHFD.
