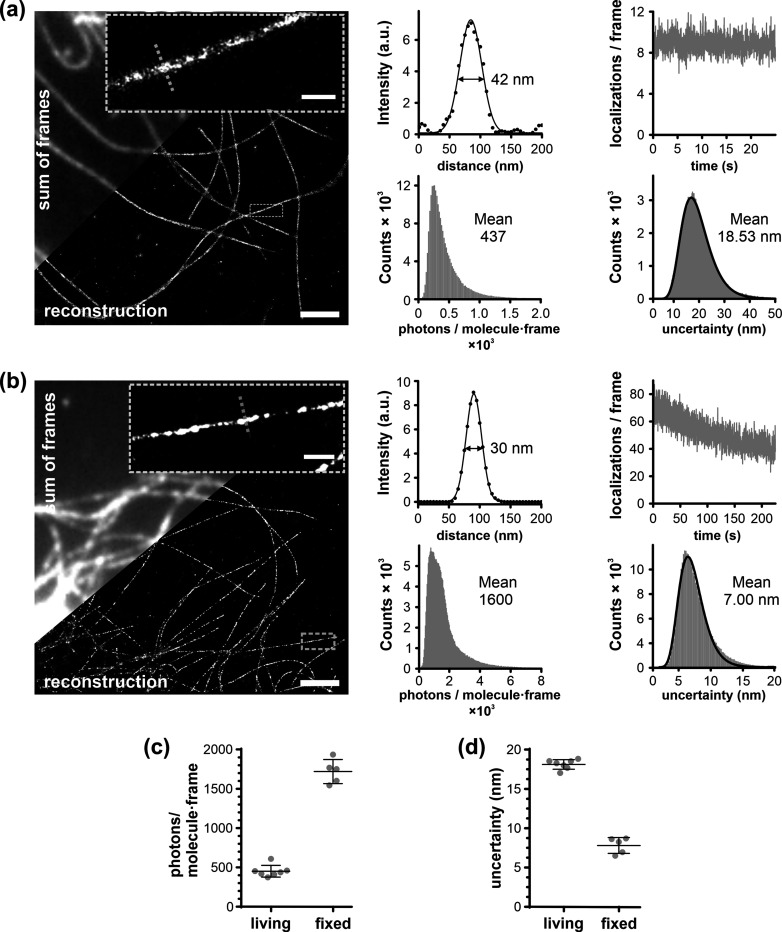
Figure 3.
SMLM imaging of microtubules in living and fixed U-2 OS cells stained with HMSiR-tubulin (3): (a) Living cells. (b) Fixed cells. Zoom-in on a single microtubule and intensity profile along the dashed line are shown, together with the corresponding fitting to the Gaussian function. Scale bar 2 μm; zoom-in 0.5 μm. The movies used for reconstruction are in Supplementary Videos 1 and 2. Fluorophore properties (histograms of localization uncertainty and photon count per molecule per frame and bleaching time-course) are shown. Fitting to log-normal distribution is shown as a thick line. Comparison of photon count per molecule per frame (c) and localization uncertainty (d) in living and in fixed samples. The data is from 6 and 7 fields of view, from 2 independently prepared samples.

