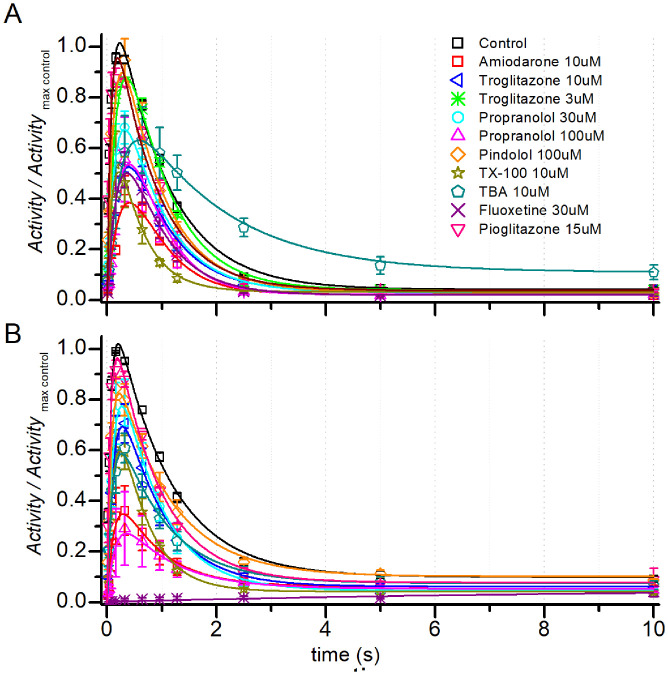
Fig. 2.
Time courses of KcsA activation and inactivation at pH 5 in the absence (Control) or presence of drugs in (A) C22:1 or (B) C18:1 Activity/ActivityMAX Control, in which each point was normalized to the maximum activity in the absence of drug for that experiment. Symbols represent mean ± SEM, and n = 34 and 24 for control in C22:1 and C18:1 respectively, in the presence of drugs n varied between 3 and 10; in case of n = 2 (pindolol), Mean ± range/2 is used. The three-state KcsA gating model (20) was used to fit the (curves) using QuB (22).

