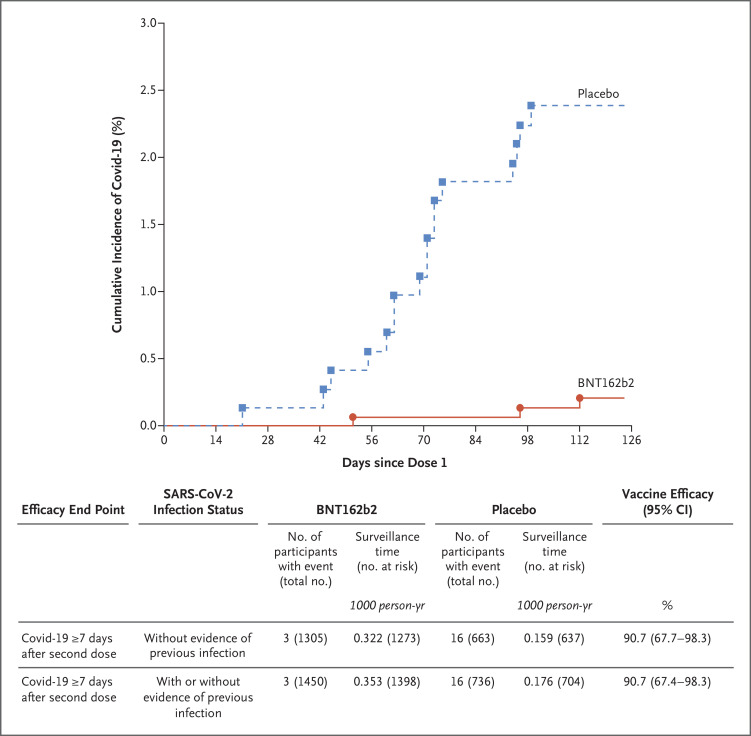
Figure 3. Vaccine Efficacy in Children 5 to 11 Years of Age.
The graph represents the cumulative incidence of the first occurrence of Covid-19 after the first dose of vaccine or placebo. Each symbol represents cases of Covid-19 starting on a given day. Results shown in the graph are all available data for the efficacy population, and results shown in the table are those for the efficacy population that could be evaluated (defined in Table S1). Participants without evidence of previous infection were those who had no medical history of Covid-19 and no serologic or virologic evidence of past SARS-CoV-2 infection before 7 days after the second dose (i.e., N-binding serum antibody was negative at the first vaccination visit, SARS-CoV-2 was not detected in nasal swabs by nucleic acid amplification test at the vaccination visits, and nucleic acid amplification tests were negative at any unscheduled visit before 7 days after the second dose). The cutoff date for the efficacy evaluation was October 8, 2021. Surveillance time is the total time in 1000 person-years for the given end point across all participants within each group at risk for the end point. The time period for Covid-19 case accrual was from 7 days after the second dose to the end of the surveillance period. The 95% confidence intervals for vaccine efficacy were derived by the Clopper–Pearson method, adjusted for surveillance time.

