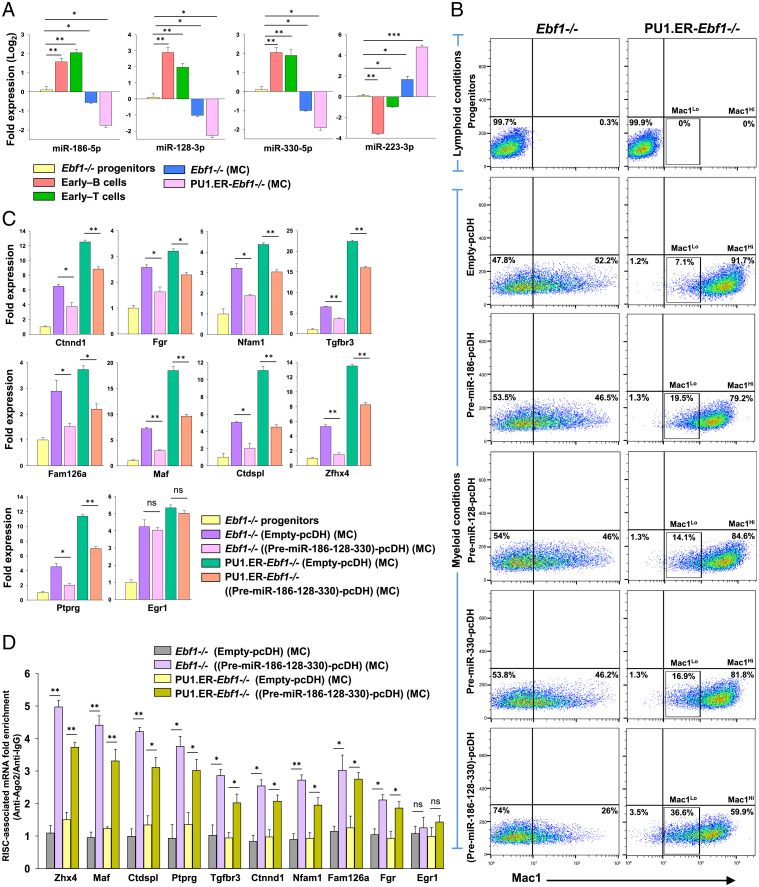
Fig. 4.
Coexpression of multiple miRNAs with distinct seed sequences decreases myeloid differentiation potential of Ebf1−/− and PU1.ER-Ebf1−/−progenitors. (A) Expression levels of miR-186-5p, miR-128-3p, miR-330-5p, and miR-223-3p (a myeloid-specific miRNA) measured using stemloop qRT-PCR in Ebf1−/− progenitors, early–B cells, early–T cells, Mac1Lo, and Mac1Hi myeloid cells (generated from Ebf1−/− or PU1.ER-Ebf1−/− progenitors, respectively, by culturing under myeloid-promoting conditions [represented as “MC”; SI Appendix, Methods]). Data are represented with Ebf1−/− progenitors as control. (B) Analysis of myeloid differentiation potential of Ebf1−/− or PU1.ER-Ebf1−/− progenitors that were transduced with Empty-pcDH or pcDH vector expressing Pre-miR-186, Pre-miR-128, and Pre-miR-330, either individually or simultaneously. Transduced cells were cultured under myeloid-promoting conditions (represented as “MC”) and analyzed for Mac1 (CD11b) expression by flow cytometry. (SI Appendix, Fig. S6E). (C) qRT-PCR analysis of transcript levels of myeloid-associated genes targeted by miRNAs: miR-186-5p, miR-128-3p, or miR-330-5p, measured in Ebf1−/− or PU1.ER-Ebf1−/− progenitors that were transduced with Empty-pcDH or (Pre-miR-186-128-330)-pcDH construct and subsequently differentiated toward myeloid lineage (represented as “MC”). Egr1, a myeloid gene, not targeted by these miRNAs was used as negative control. Data are represented with Ebf1−/− progenitors as control sample. (D) RIP-qPCR analysis showing fold enrichment (Ago2-IP versus IgG-IP) of myeloid-associated transcripts targeted by miRNAs: miR-186-5p, miR-128-3p, or miR-330-5p, within the RISC-complexes of Ebf1−/− or PU1.ER-Ebf1−/− cells that were transduced with Empty-pcDH or (Pre-miR-186-128-330)-pcDH construct and subsequently differentiated toward myeloid lineage (represented as “MC”) (for A–D, two independent experiments were performed, each in duplicates, and data are shown as mean ± SD [*P ≤ 0.05; **P ≤ 0.01; ***P ≤ 0.001; and ns = not significant]).

