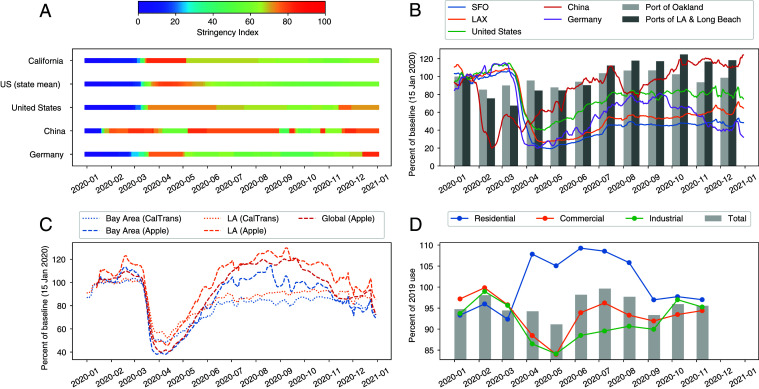
Fig. 2.
Metrics for change in human activity at different scales show that the strongest impact of COVID-19 lockdowns was in the transportation sectors and that these impacts varied substantially from country to country. A shows the Oxford Stringency Index (1) for the regions used in this figure. “US (state mean)” is the average of individual states’ indices, and “United States” is the index attributed to the United States as a whole (not individual states; see SI Appendix for discussion). B shows the percent change in flights (2–4) for two California airports (San Francisco International Airport [SFO] and Los Angeles International Airport [LAX]) and three countries (lines) and container moves for three California ports (bars). C shows traffic metrics for two California urban areas and 26 countries (“global”). CalTrans indicates California Department of Transportation Performance Measurement System data; Apple indicates Apple driving mobility data. D shows electricity consumption in the United States by sector, relative to the same month in 2019. The three sectors shown constitute of US power consumption. In B and C, daily metrics are relative to 15 January 2020 and presented as 7-d rolling averages, and monthly metrics are relative to January 2020. Electricity consumption was not available after November 2020 at the time of writing.

