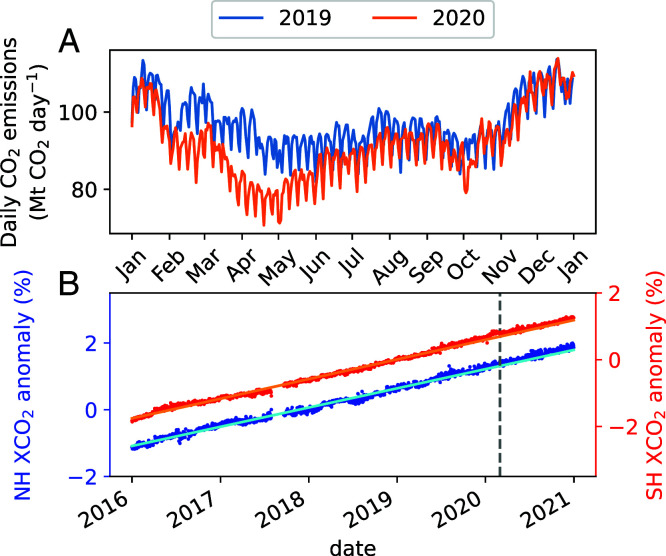
Fig. 4.
Despite substantial reductions in anthropogenic CO2 emissions in early 2020, the annual atmospheric CO2 growth rate did not decline. A shows daily global CO2 emissions for 2019 and 2020, calculated following Liu et al. (13). B shows trends in atmospheric column average CO2 from the OCO-2. The small blue and red symbols indicate daily, deseasonalized values as percent anomalies relative to the global 2018 mean. The solid cyan and orange lines are linear fits to 2016–2019 data. In B, the vertical gray dashed line marks 1 March 2020 as the approximate beginning of lockdowns in response to COVID-19. A version of B showing the absolute trends and the data including the seasonal cycle is available in SI Appendix, Fig. S8.

