. 2021 Nov 4;57(93):12436–12451. doi: 10.1039/d1cc04805h

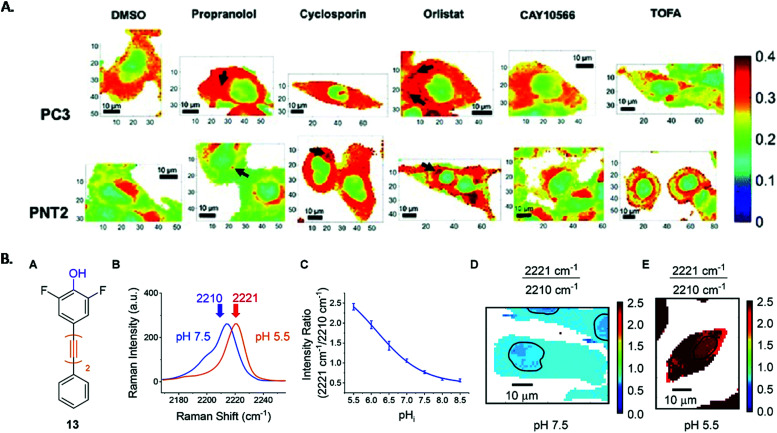
Fig. 1. (A) Ratiometric Raman images of intracellular lipid distribution of PC3 and PNT2 cells treated with DMSO (control) and a lipid altering drug. False colour images are the ratio of the peak intensity at 2851 cm−1 and the sum of the peak intensities at 2933 cm−1 and 2851 cm−1, which reflected the lipid/(protein + lipid) ratio. Visual examination allows comparison between cancerous and non-cancerous cells to be made.30 B. Experimental procedure of intracellular pH sensing (A) structure of phenol, (B) spectra from PC3 cells at pH 7.5 (blue) and pH 5.5 (orange), (C) calibration curve of phenol in PC3 cells created using 2221/2210 cm−1 intensity ratio from PC3 cells, (D) and (E) false colour images of PC3 cells at pH 7.5 and pH 5.5 created using 2221/2210 cm−1 ratios. Nuclear regions highlighted by blank band.102 Reproduced from ref. 30 and 102 with permission from the Royal Society of Chemistry.

Fig. 1