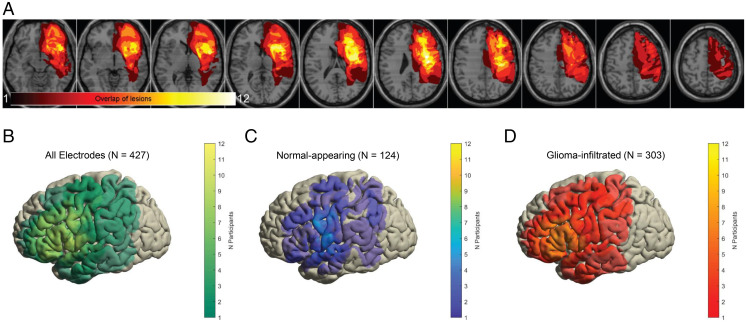
Fig. 2.
Heatmaps demonstrating regions of glioma infiltration (A) and electrode coverage (B–D). (A) For each participant, regions of abnormally elevated T2-FLAIR signal representing glioma infiltration were manually segmented and interpolated in three dimensions. These segments were subsequently summed across all participants to generate a heatmap which demonstrates focal involvement of the left perisylvian language areas. (B–D) Common cortical surfaces showing the number of participants with electrode coverage at a given region: all electrodes (B), electrodes overlying normal-appearing cortex (C), and electrodes overlying glioma-infiltrated cortex (D). Speech planning and initiation sites are represented in both normal-appearing and glioma-infiltrated cortex.

