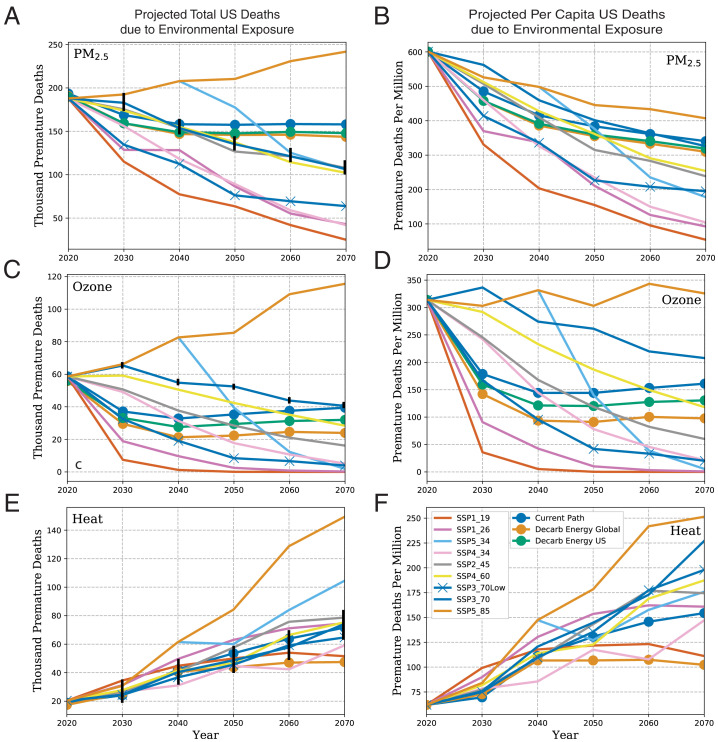
Fig. 2.
Annual premature deaths in the United States due to PM2.5 (A and B), ozone (C and D), and heat (E and F) in the indicated SSP and energy-sector decarbonization scenarios as totals (Left column) and per million persons (Right column). Values for premature deaths due to heat exposure in the decarbonization of the US energy sector simulation are not shown as these are indistinguishable from the reference case (Current Path). CI (95%) based on internal variability in our model are shown as vertical bars for the SSP3_70 scenario totals to illustrate when scenarios are distinct (overall uncertainty, including exposure-response functions, is much larger but that additional uncertainty is systematic). Uncertainty in physical modeling would add an additional contribution of ∼25% for air pollution and ∼38% for heat to the range of projected changes.

