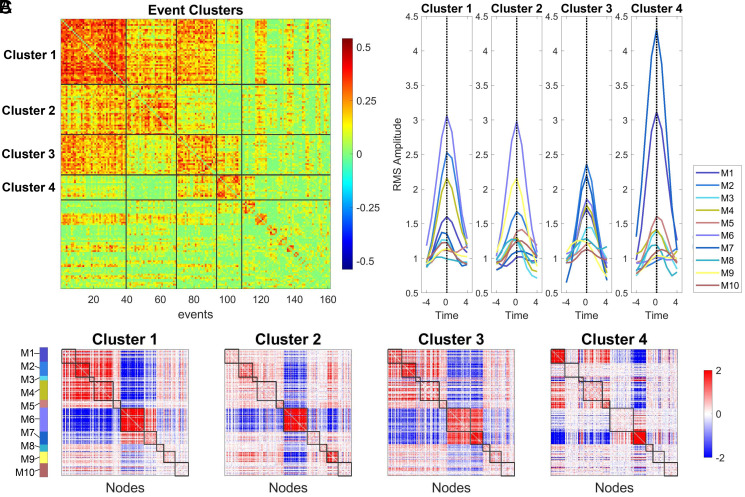
Fig. 5.
Event clusters and relation to SC consensus modules. (A) Clustered correlation matrix of event patterns (k = 280, 161 events). Matrix is reordered to show event clusters from largest to smallest. The top four clusters are delineated and contain 37, 30, 26, and 15 events, respectively. (B) Means of the events clusters (cluster centroids) displayed in matrix form, with nodes arranged in SC consensus order (cf. Fig. 2). (C) Mean time courses of RMS, computed for each SC consensus module, with time courses aligned to the event peak for each of the four main event clusters (means of 37, 30, 26, and 15 events, respectively). Time courses show mean cofluctuation amplitude for each SC consensus module.

