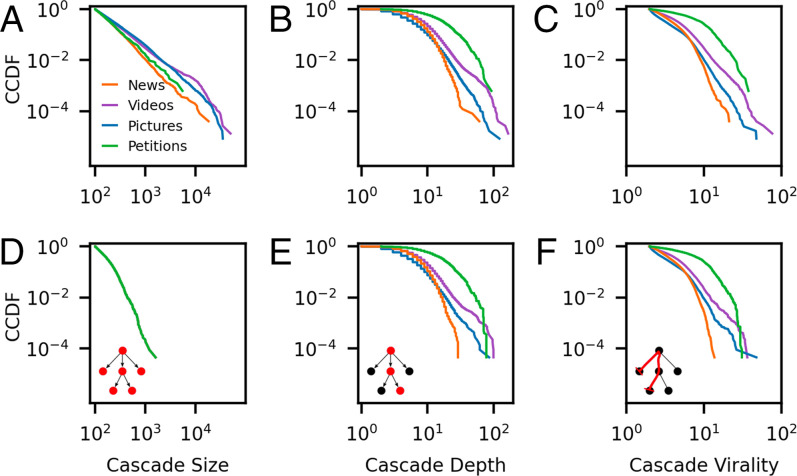
Fig. 2.
(A–C) Structural statistics of videos, images, news, and petitions on Twitter, as presented by ref. 10. Note that only cascades containing at least 100 posts are included in the analysis. Cascades in the four categories of content have different size distributions (A). (D–F) The same analyses as the plots directly above, carried out for subsampled datasets with matched size distributions. Controlling for size does not collapse statistical differences in these properties. Insets depict each statistic on a simple cascade.

