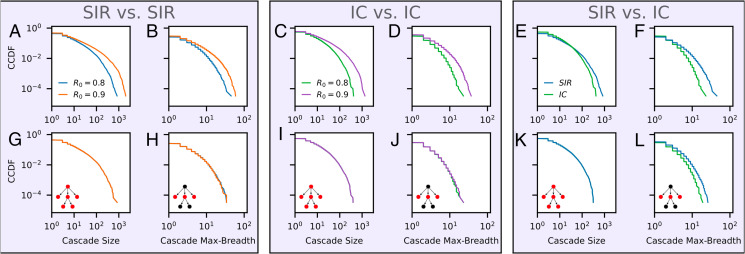
Fig. 3.
(A–F) Structural statistics of datasets of cascades simulated using the SIR and IC models. (A and B) Size and maximum breadth of SIR cascades with two different values of the infectivity parameter R0. (C and D) Size and maximum breadth of IC cascades with two different values of R0. (E and F) Size and maximum breadth of SIR vs. IC cascades with the same choice of . (G–L) The same analyses as the plots directly above, carried out for two subsampled datasets with matched size distributions. Controlling for size collapses statistical differences in structural properties when simulations come from the same underlying model (IC or SIR), even for different choices of infectivity R0. The collapse does not happen if the underlying models are different. Insets again depict each statistic on a simple cascade. Only size and breadth are shown here due to space constraints; the collapses of the remaining statistical quantities are shown in SI Appendix, Figs. S14, S18, and S22.

