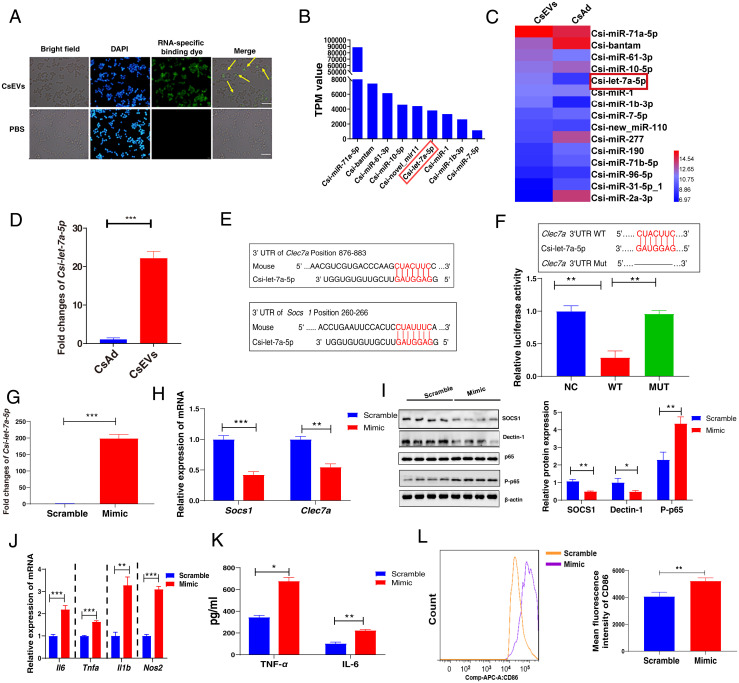
Fig. 4.
Characterization of enriched miRNAs profiles in CsEVs and identification of the targets of Csi-let-7a-5p packaged by CsEVs. (A) CsEVs delivering miRNAs labeled with the green dyes were found within the macrophages as shown by the fluorescence microscope (scale bars, 50 μm). The yellow arrow shows the internalized miRNA in the macrophage cell line RAW 264.7. (B) The top nine most abundant miRNAs (>1,000 TPM values) in CsEVs were identified using high-throughput sequencing. (C) The comparison of the abundances of miRNAs (>100 TPM) between CsEVs and adult worms showed by the heatmap. (D) The relative expression of Csi-let-7a-5p in the CsEVs and adult worms were determined by qPCR. (E) The potential binding sites of Csi-let-7a-5p in 3′UTR of Clec7a and Socs1 were predicted using the intersection of TargetScan, MiRanda, and PicTar databases. (F) The luciferase activities were measured in the 293T cells that were transfected with either a pmiReport empty vector control (NC), Clec7a-3′UTR (full length, WT), or deletion of Csi-let-7a-5p binding site on Clec7a 3′UTR (MUT) report gene plasmid for 24 h. (G) The levels of Csi-let-7a-5p in macrophages after Csi-let-7a-5p mimic were transfected for 24 h using qPCR. (H) The relative mRNA expression of Socs1 and Clec7a in the macrophages that were transfected with Csi-let-7a-5p mimic or scramble for 24 h. (I) The levels of SOCS1, Dectin-1 (encoded by Clec7a), and P-p65 in macrophages that were transfected with Csi-let-7a-5p mimic or scramble for 24 h. (J) The relative mRNA expression of Il6, Tnfa, Il1b, and Nos2 in the macrophage that was transfected with Csi-let-7a-5p mimic or scramble for 24 h. (K) The secretion of TNF-α and IL-6 in the cultures of macrophages that were transfected with Csi-let-7a-5p mimic or scramble for 24 h. (L) The mean fluorescence intensity of CD86 in macrophages that were transfected with Csi-let-7a-5p mimic or scramble for 24 h using flow cytometry. The values were expressed as mean ± SEM. Compared with indicated groups, *P < 0.05, **P < 0.01, ***P < 0.001.

