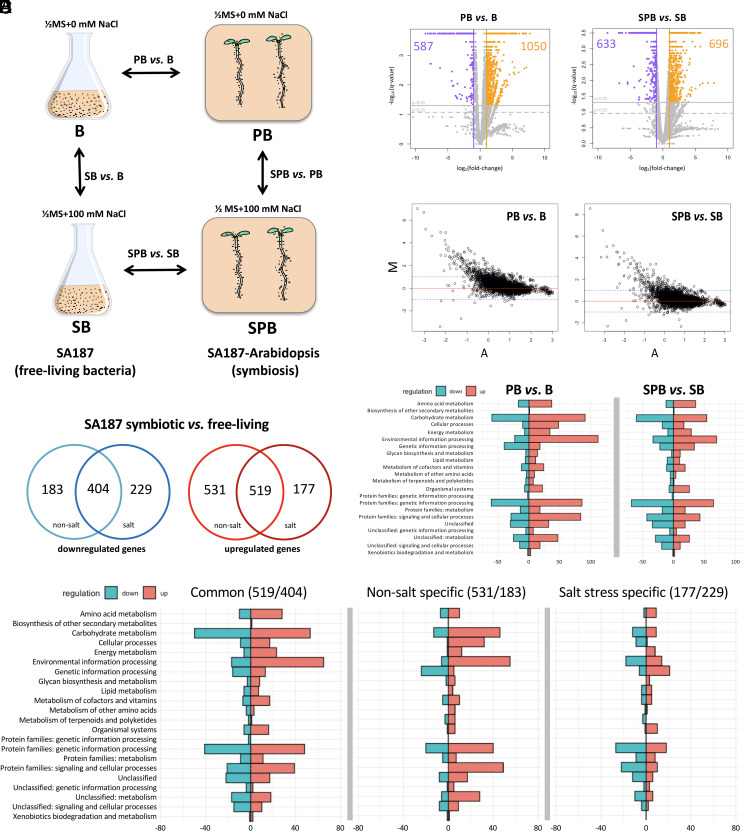
Fig. 1.
Scheme of experimental setup: SA187 was incubated in 1/2MS without (B) or with 100 mM NaCl (SB) for 4 h at 28 °C. Arabidopsis seedlings were germinated for 5 d, with or without SA187 before transfer to fresh 1/2MS plates for 12 d without (P, PB) or with 100 mM NaCl (SP, SPB) and vertically grown for 12 d (22 °C, 16/8 h light/dark cycle) (A). Volcano plots of SA187 DEGs in free-living and endophytic conditions with and without salt: to analyze the effect of salinity, SA187 in 1/2MS + 100 mM NaCl (salt stress) was compared to SA187 grown in 1/2MS (mock) in both free-living and plant-associated conditions (B). MA plots: representation of the gene expression fold change (M-axis) versus the mean gene expression values (A-axis) for each comparison. Dotted blue line marks the differential expression fold change = 2 [log2(fold change) = 1], those genes showing M > 1 as up-regulated and M < −1 as down-regulated. M = log2(log10(FPKM2)/(log10(FPKM1)), A = 1/2log2(log10(FPKM1)*log10(FPKM2)). Zero values of FPKM were ignored. Scatter plots were generated with R (Rstudio version 1.0.136) (C). Venn diagram showing up- and down-regulated genes that are common or specific for mock and salt stress conditions, comparing SA187 endophytic to free-living state (q-value <0.05) (D). KO functional analysis: metabolic processes regulated in response to the adaptation to the plant-associated lifestyle under nonsalt (PB versus B) and salt stress conditions (SPB versus SB) (E). Metabolic processes up- and down-regulated in response to plant associations that are common in both control and salt stress conditions (Left) or specific to control condition (Center) or salt stress (Right) (F). y-axis = KEGG functional categories. x-axis = number of genes or KO identifiers in KEGG knowledgebase from each subset of regulated genes in our analysis. Up-regulated metabolic processes are in red and down-regulated in blue.

