
Figure 1. Expression of filaggrin (FLG) and loricrin (LOR) in the skin from normal subjects and patients with psoriasis.
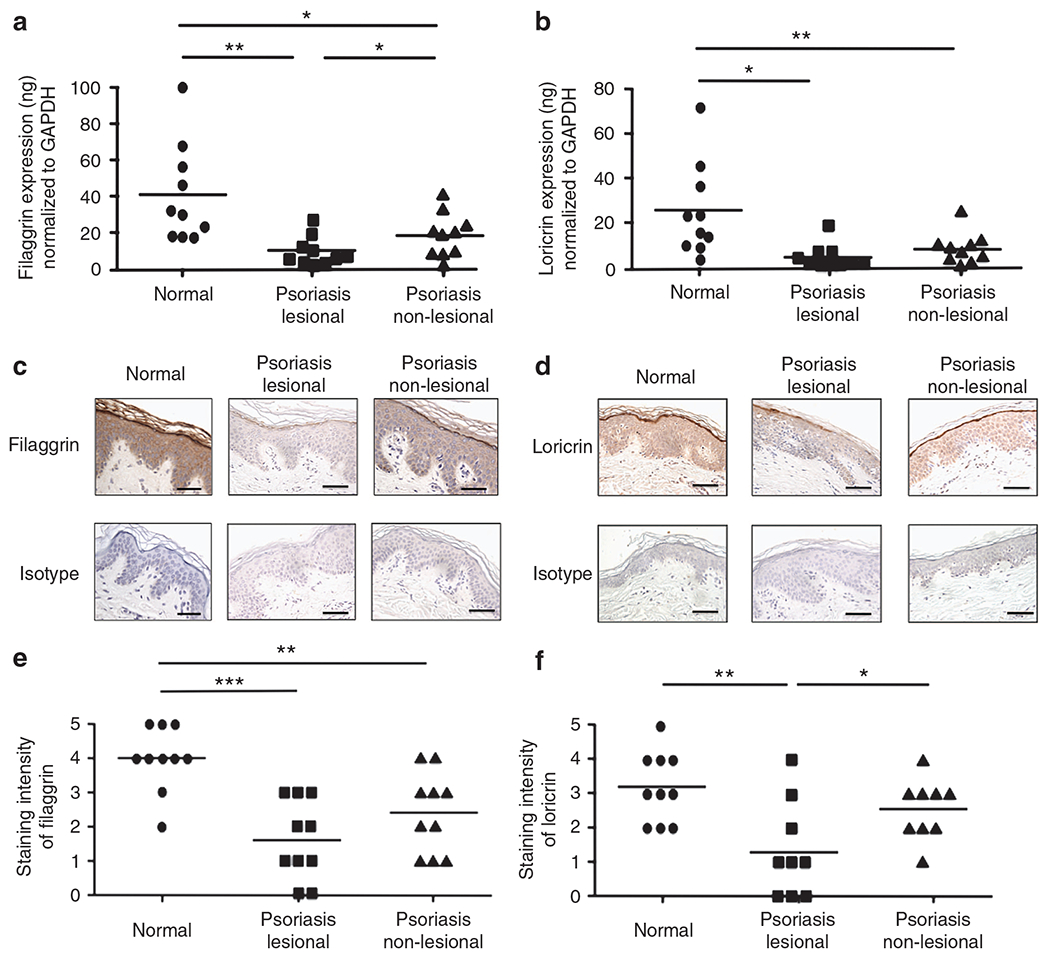
RNA was isolated from the skin of normal subjects and patients with psoriasis. The gene expression FLG (a) and LOR (b) was evaluated using real-time RT-PCR. (c, d) Representative paraffin-embedded skin biopsies from normal subjects (n = 10) and patients with psoriasis (n = 9) stained for FLG (c) and LOR (d) are shown. Images were collected at × 400 magnification. (e, f) The intensities of the staining for FLG (e) and LOR (f) were graded visually on a scale from 0 (no staining) to 5 (the most intense staining). The scale bar represents 50 μm. *P<0.05; **P<0.01; ***P<0.001. GAPDH, glyceraldehyde-3-phosphate dehydrogenase.