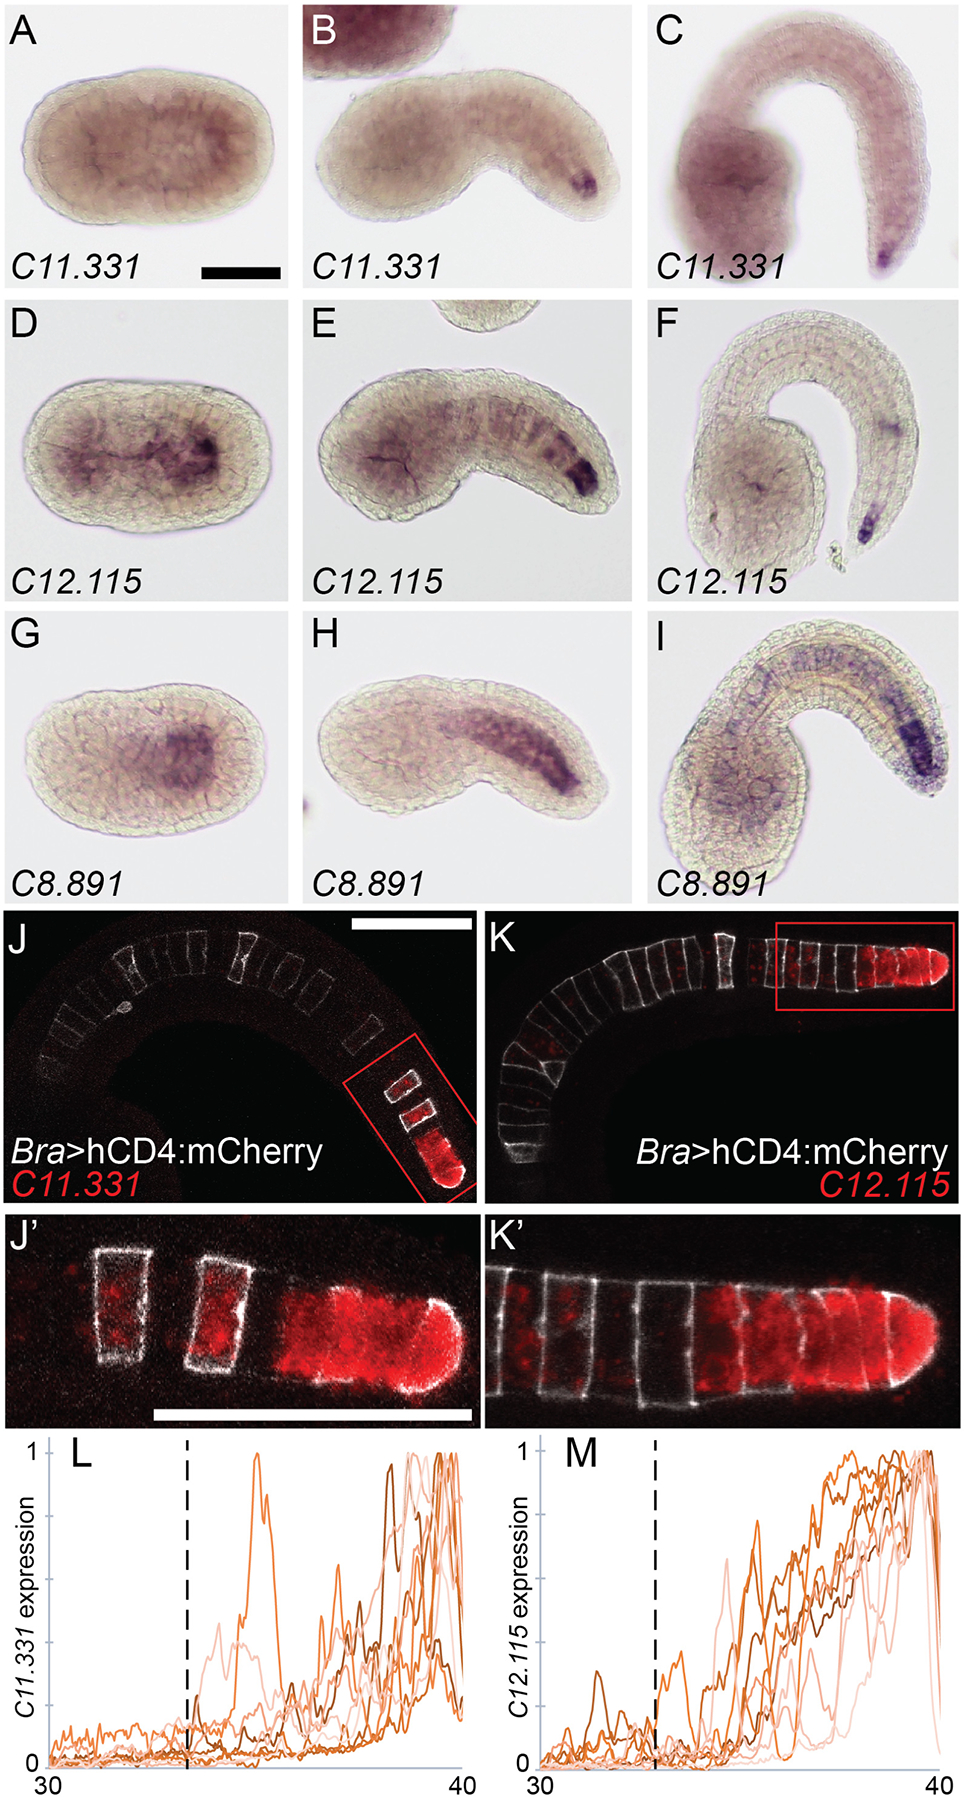
Fig. 1. Secondary-enriched notochord genes.

In situ hybridization of probes against (A-C) KH.C11.331, (D-F) KH.C12.115 and (G-I) KH.C8.891. Expression was tested during early intercalation at Hotta stage 16 (A, D, G), late in intercalation at Hotta stage 20 (B, E, H) and during notochord elongation at Hotta stage 23 (C, F, I). J-K) Fluorescent in situ hybridization against C11.331 (J) and C12.115 (K) in red at Hotta stage 22. Embryos were electroporated with Bra>hCD4:mCherry (white). J’-K’) Closeup of secondary notochord region indicated by red box in (J,K). L-M) Background subtracted and normalized expression of C11.331 (L) and C12.115 (M) in notochord cells 30–40. Nine embryos for each gene are shown. The location of the primary/secondary border is indicated by the vertical dotted line. Scale bars = 50 microns.
