
Fig. 3. Cis-regulatory analysis of the C11.331 upstream intergenic region.
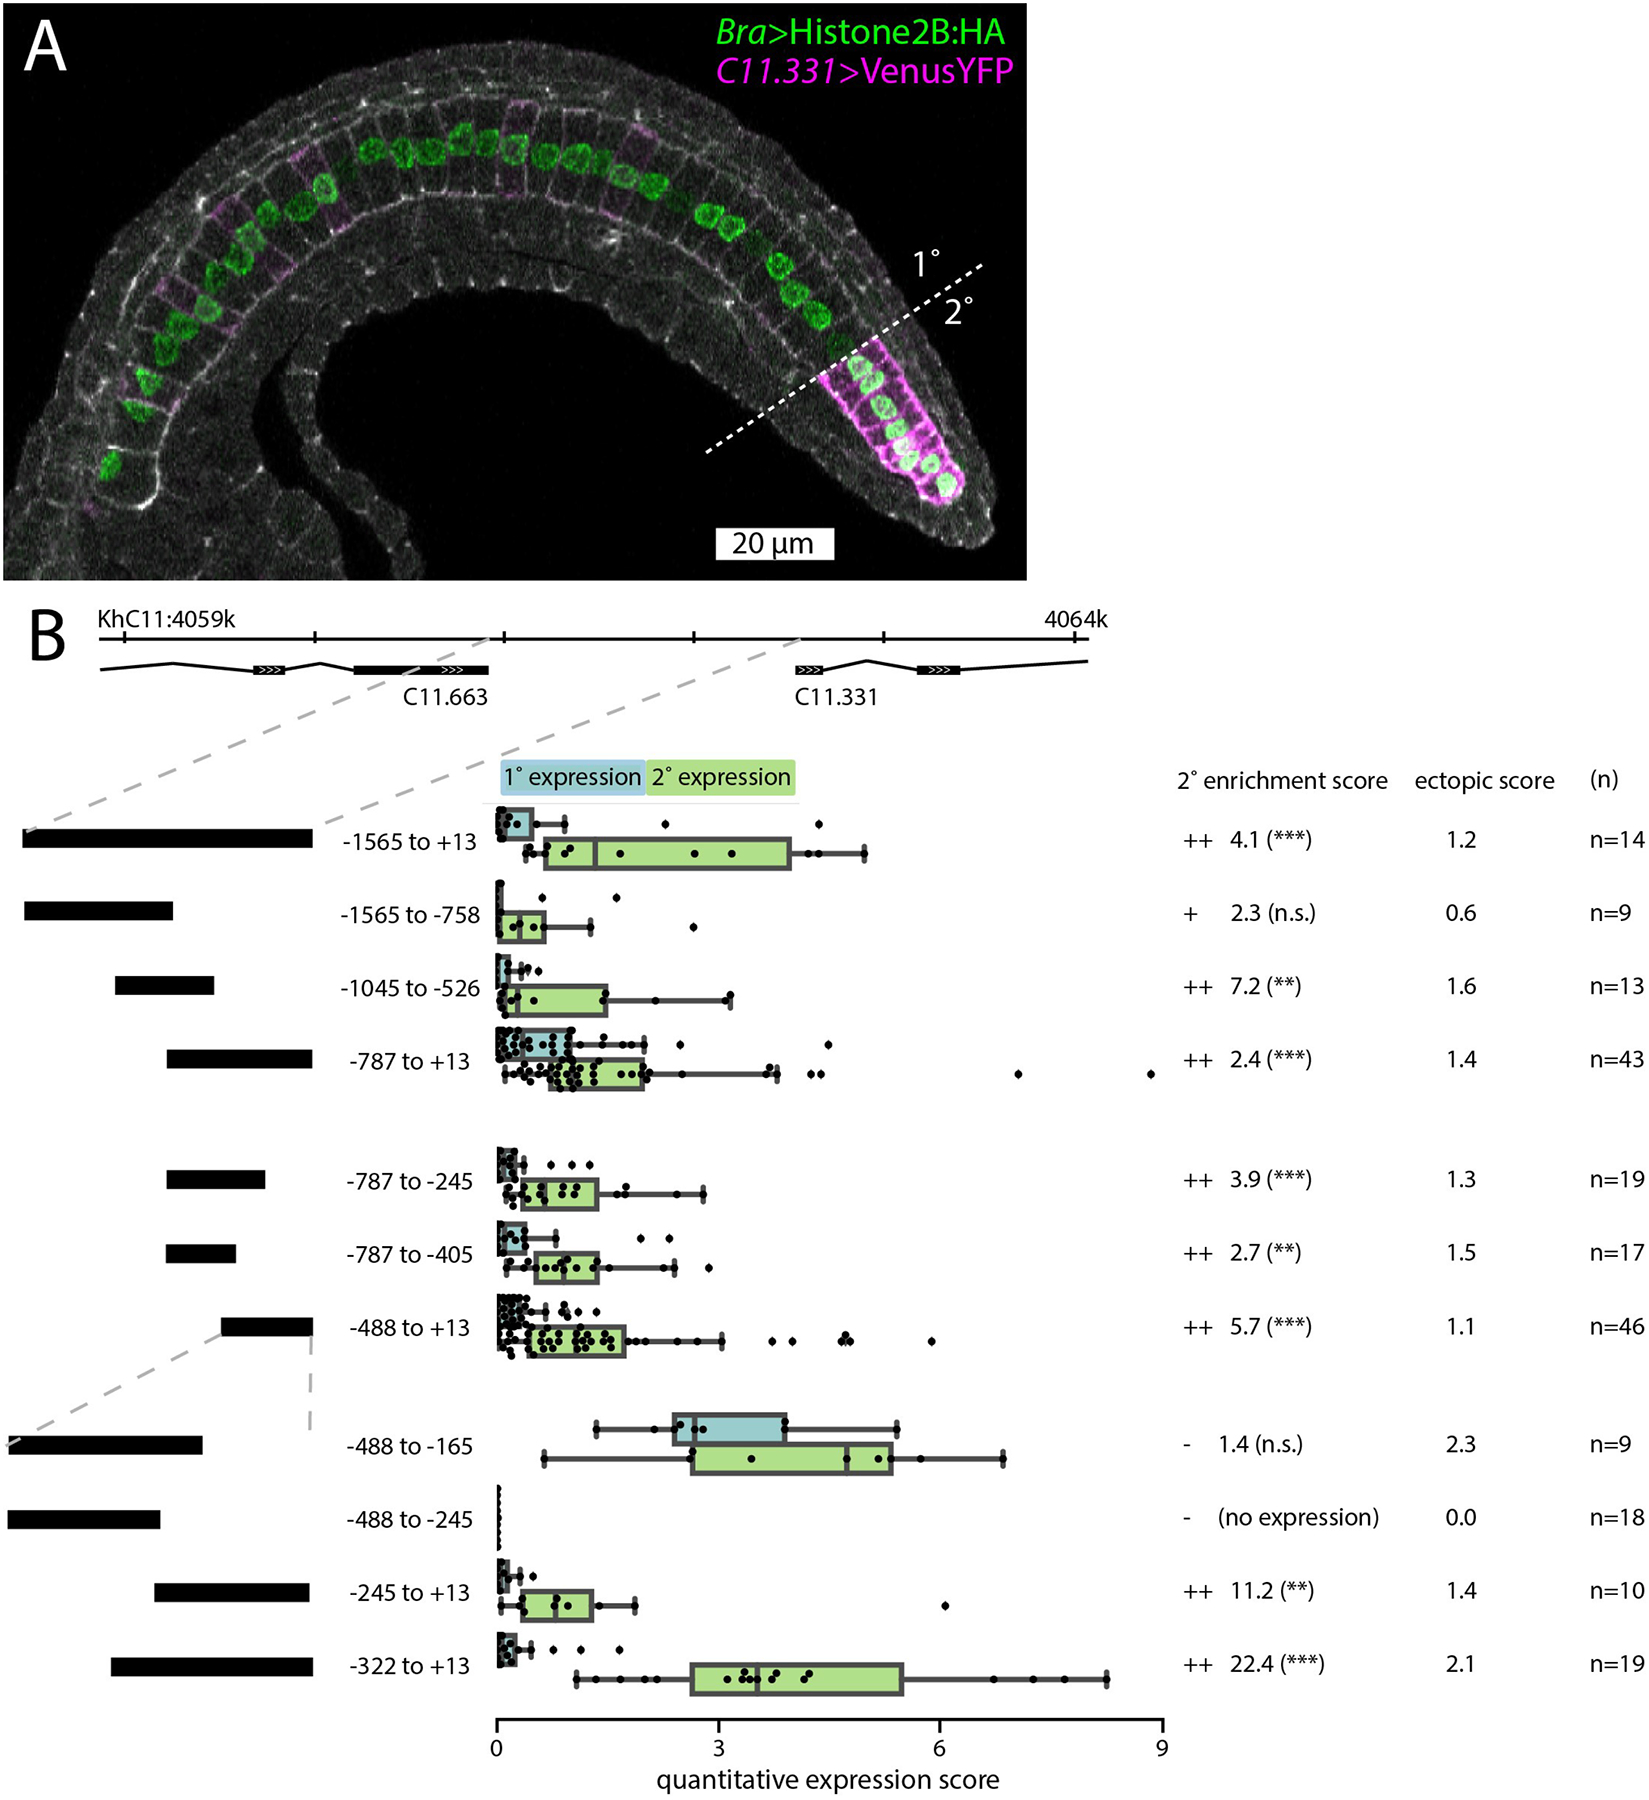
A: Representative embryo expressing C11.331 (−787 to +13)>Venus and Bra>Histone2B:HA fixed during tail elongation at Hotta stage 22. Cell cortices are labeled with Phalloidin-Alexa633 (white). Primary/secondary notochord boundary indicated with dashed line. Anterior is to the left and dorsal is to the top of the image. B: Summary statistics from reporter assays for the full-length C11.331 upstream region and a series of truncation mutants. Construct coordinates refer to the predicted transcriptional start site for C11.331. C11.331 quantitative expression score distributions are shown for primary (blue) and secondary (green) notochord. The superimposed box plots for each distribution show the median flanked by the interquartile range, with whiskers extending to the full range excluding outliers >1.5X IQR. Expression differences between notochord regions for each reporter are shown as enrichment scores, calculated as the mean secondary expression divided by the mean primary expression. ++ indicates that the construct was enriched in secondary notochord with statistical significance <0.05. + indicates that the construct showed signs of enrichment in secondary notochord but it was not statistically significant. – indicates that the construct was not enriched in secondary notochord. Secondary enrichment was tested by one-tailed Wilcoxon signed-rank tests (*, p<0.05; **, p<0.005; ***, p<0.0005). The ectopic expression scores represent the average expression in 5 non-notochord tissues using a 0–4 qualitative expression scale described in the methods. For a tissue-specific breakdown of the scores, see Tables S3,S4.