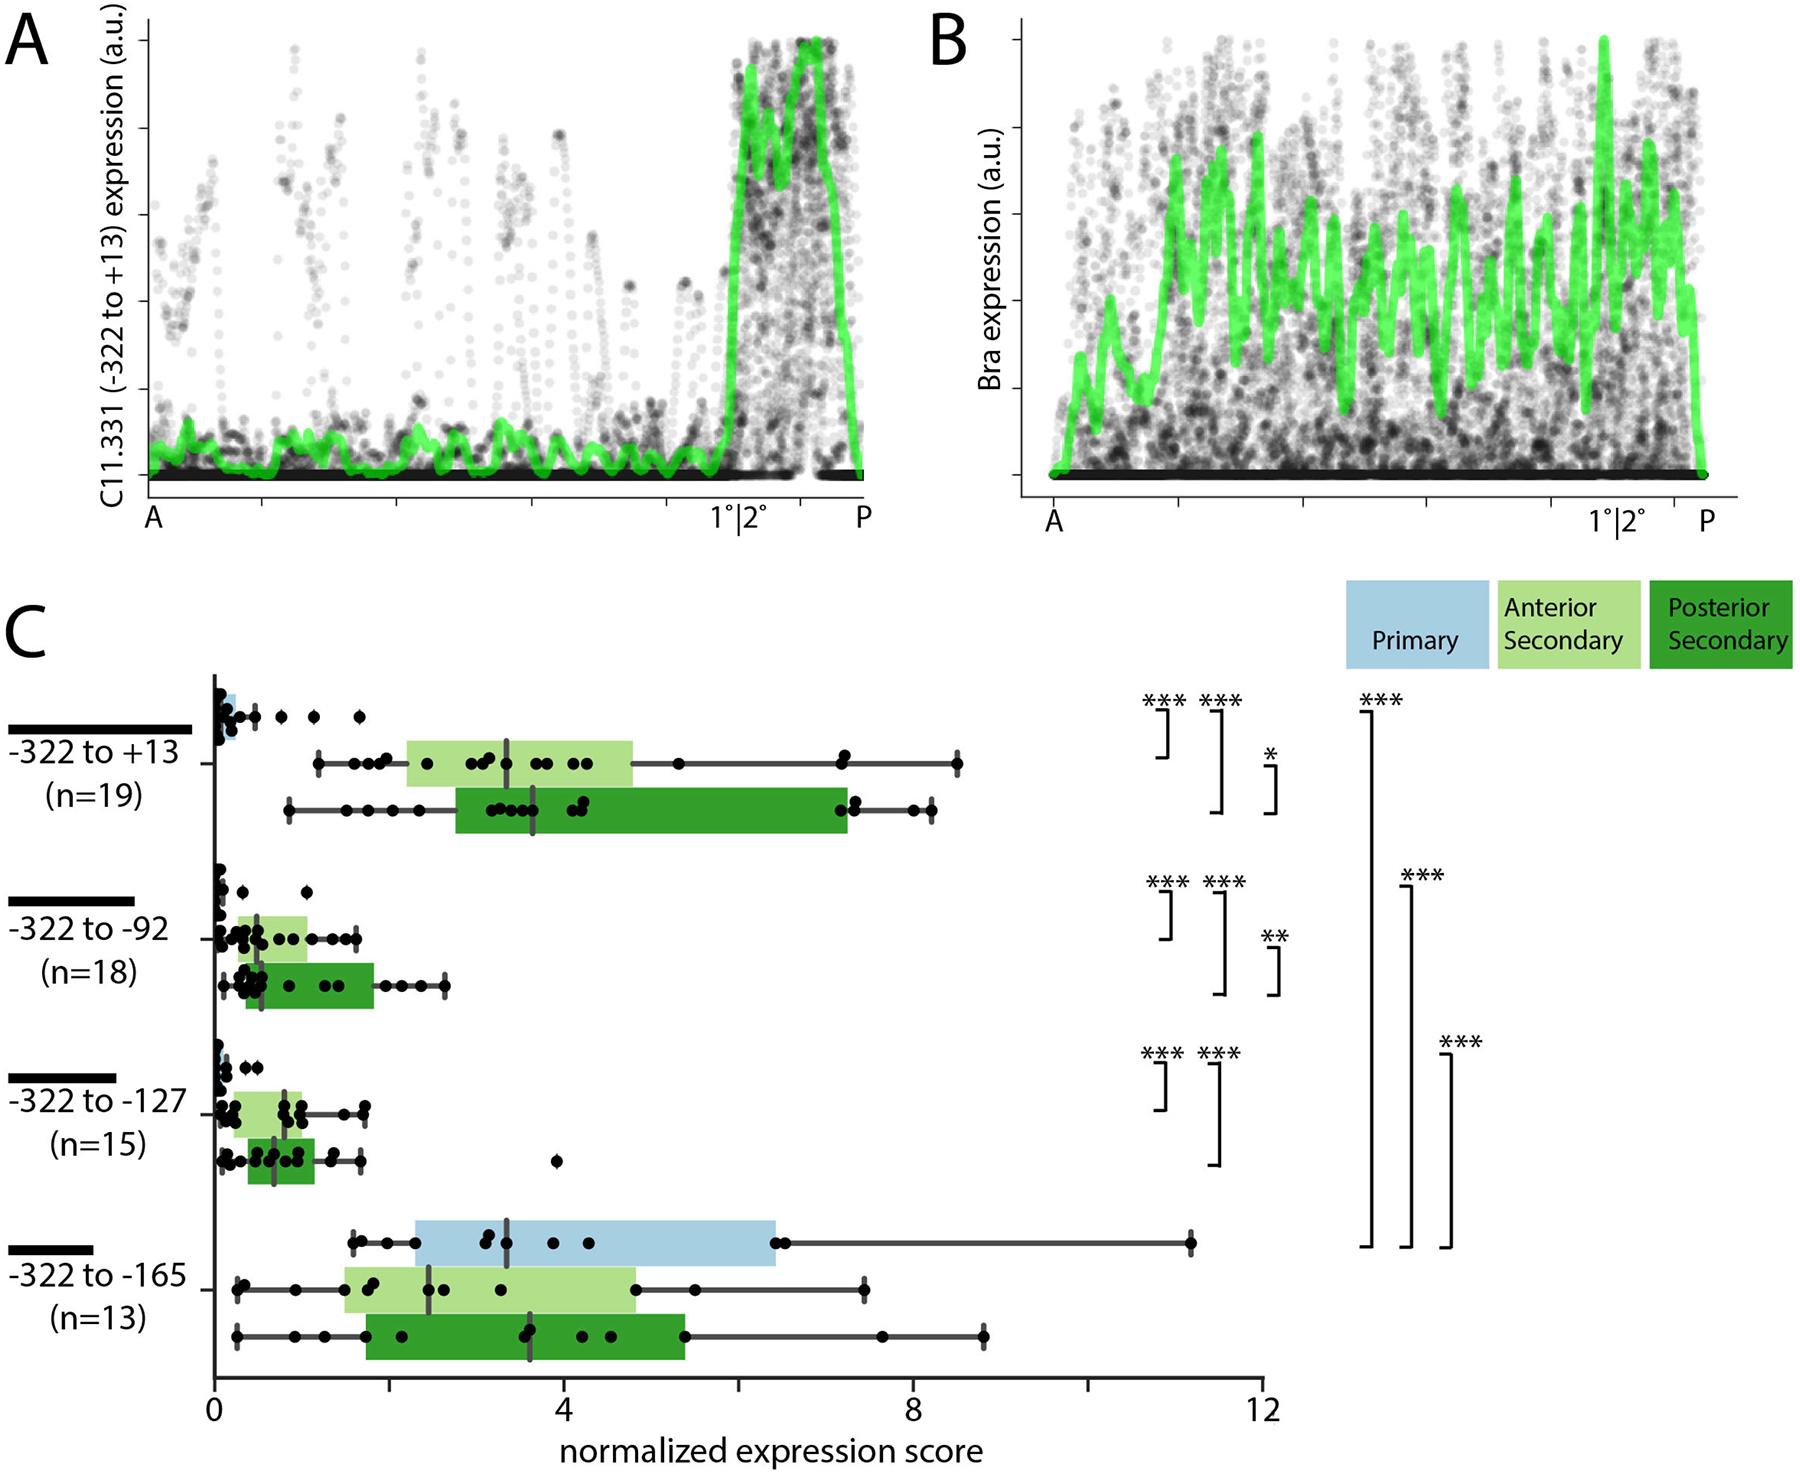
Fig. 4. Quantitative analysis of the C11.331(−322 to +13) CRM.

A-B) Quantitative traces of C11.331 (−322 to +13) (A) and Bra (B) expression from 19 embryos as a function of anterior-posterior position. Expression data from each embryo was scaled in intensity to {0 1}, scaled to a common length, aligned by the primary/secondary notochord boundary and plotted as transparent gray to help visualize overlapping data points. Normalized mean intensity is overlaid in green. C) C11.331 quantitative expression score distributions are shown for primary (blue) anterior secondary (light green) and posterior secondary (dark green) notochord. The superimposed box plots for each distribution show the median flanked by the interquartile range, with whiskers extending to the full range excluding outliers >1.5X IQR. Expression differences between notochord regions for a given reporter were tested by one-tailed Wilcoxon signed-rank tests. Expression differences for each notochord region between the different reporter constructs were tested by ANOVA followed by Tukey’s Honest Significant Difference post-hoc test (*, p<0.05; **, p<0.005; ***, p<0.0005).
