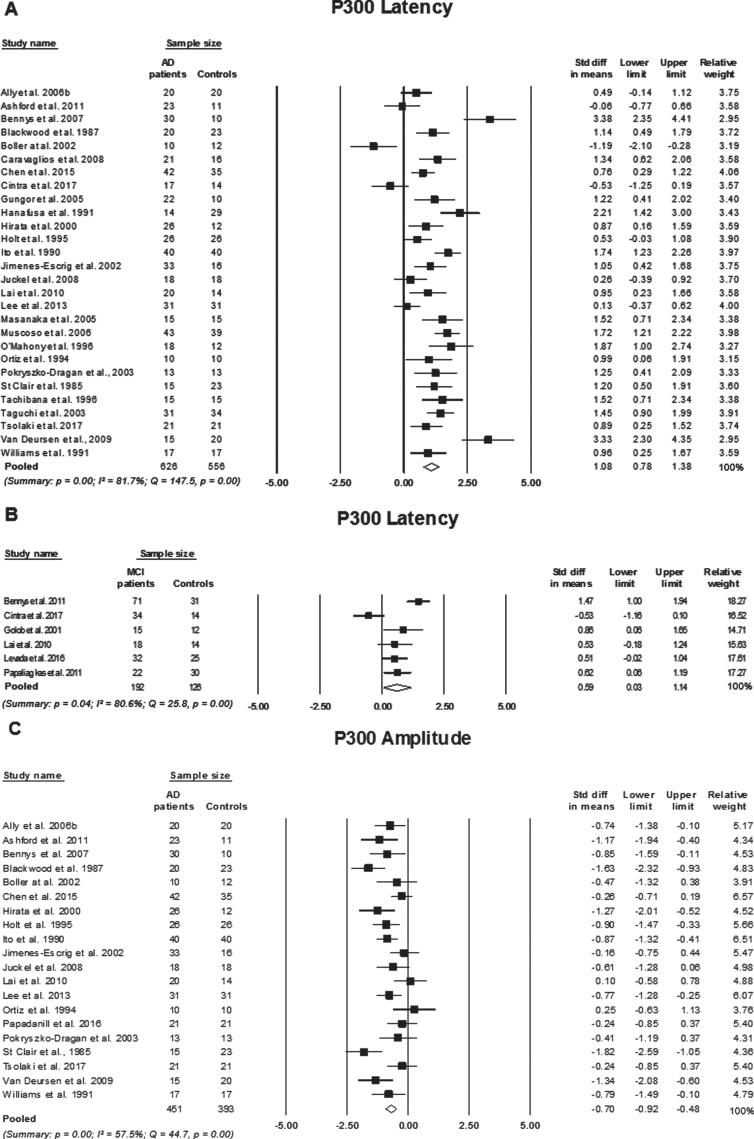
Fig. 6.
Standard mean difference and pooled estimated of each study included in the meta-analyses of P300 elicited using an active two-tone oddball paradigm. A) comparing P300 latency between participants with Alzheimer’s disease (AD) and controls, B) comparing P300 latency between participants with mild cognitive impairment (MCI) to controls, and C) comparing P300 amplitude between participants with AD to controls. Summary includes: p = significance level; I2 = percentage of heterogeneity; Q = Cochrane’s Q. The horizontal lines represent the 95%confidence interval for each computed standard mean difference. Note: weights are from random effects analysis.

