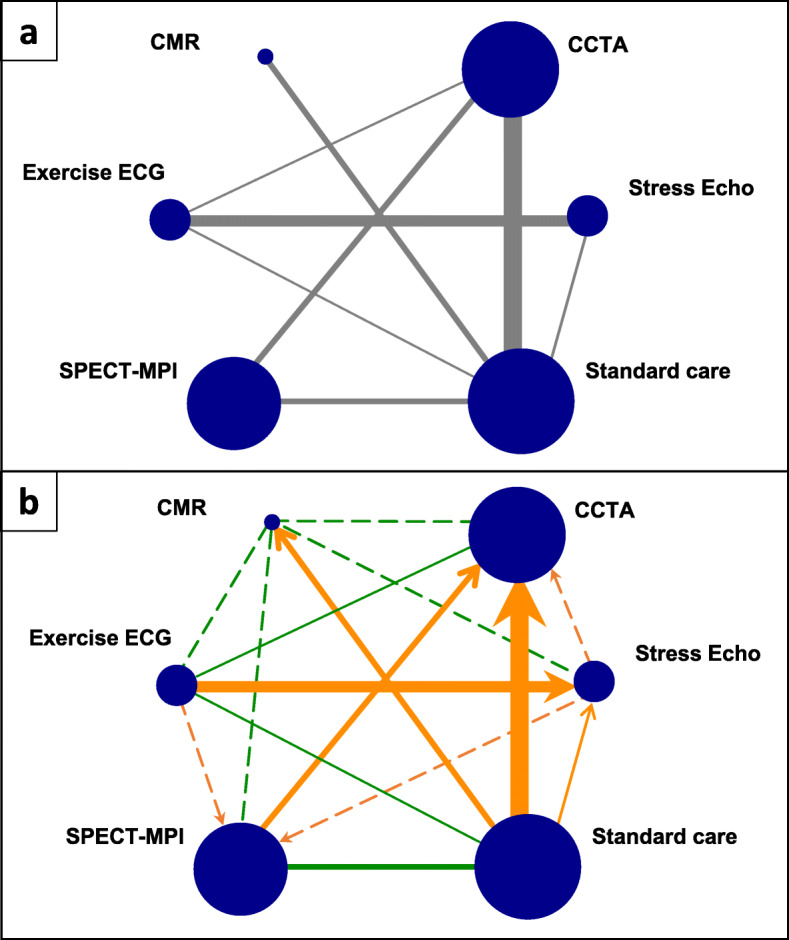
Fig. 1.

Network plots of network meta-analysis of non-invasive diagnostic modalities for detecting coronary artery disease. a Standard network plot. b Network graph showing risk of bias assessment for pairwise comparisons. Sizes of solid lines and nodes are proportional to number of studies in each comparison and total sample size for each treatment, respectively. Solid lines represent the observed direct comparisons, dotted lines represent unobserved comparisons between interventions. Green indicates no bias detected, orange indicates suspected bias favouring the treatment indicated by the arrow. ECG: electrocardiogram; CCTA: coronary computed tomographic angiography; CMR: cardiovascular magnetic resonance; SPECT-MPI: single-photon emission computed tomography-myocardial perfusion imaging; Stress Echo: stress echocardiography
