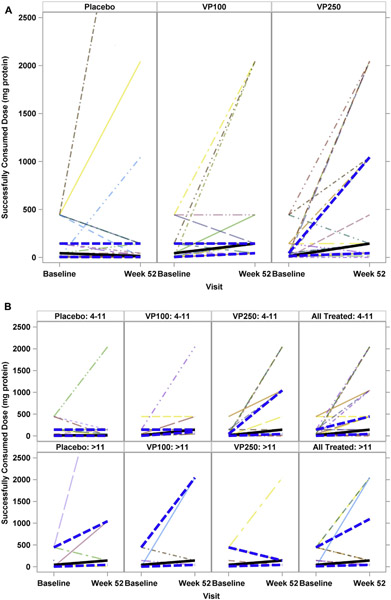
FIG 2.
SCD from baseline to the week 52 OFC. A, Analysis by treatment group. B, Analysis by age and treatment group. Top panels represent the 4- to 11-year-old age group. Bottom panels represent the greater than 11-year-old age group. Solid lines represent median values, and hatched lines represent the upper and lower IQR.

