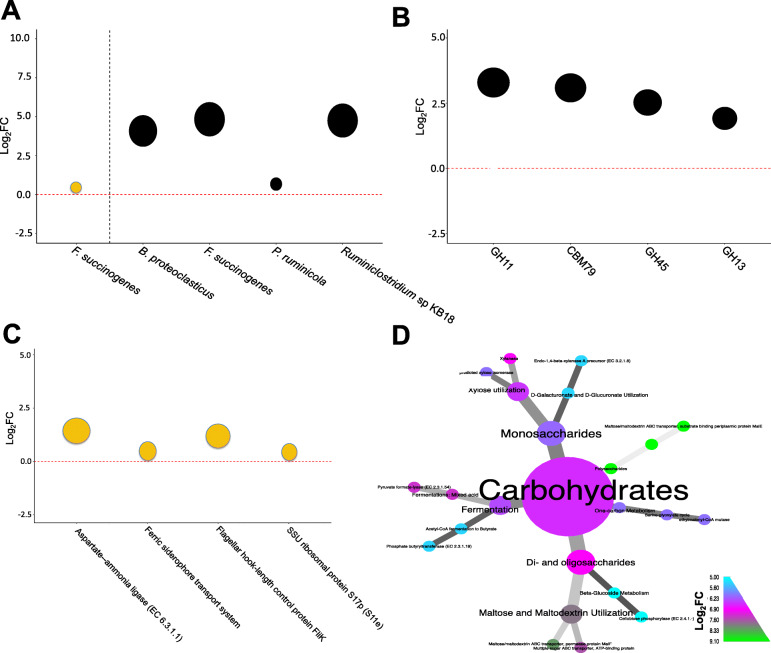
Fig. 2.
Fibrolytic bacteria and glycoside hydrolases are abundant in feed efficient cattle. A Log2-fold increase in the abundance of F. succinogenes in L-FCR compared to H-FCR on Day 0 (orange dot). Log2-fold increase in the abundance of four bacterial species on the 180th day relative to day 0 in L-FCR compared to H-FCR (dark dots). The black dashed line was drawn to separate the two time points. B Log2-fold increase in the abundance of four CAZyme families on the 180th day relative to day 0 in L-FCR compared to H-FCR (dark dots). C Log2-fold increase in the abundance of four microbial functions in L-FCR compared to H-FCR on day 0 (orange dots). D Heat tree showing the log2-fold increase in the abundance of microbial functions on the 180th day relative to day 0 in L-FCR compared to H-FCR (dark dots). Features were significant (P < 0.05) according to the trimmed mean of M-values (TMM) method implemented in edgeR [35–37]. The TMM method was used to normalize the data and minimize the log2-fold changes between samples. All P values were corrected for a false discovery rate (FDR) of 0.05 using the Benjamin-Hochberg algorithm [38], and FDR-corrected P values were considered as significant. In the heat tree, node colors indicate the log2fc in the significant (P < 0.05) microbial functional categories classified at level 4 by MG-RAST [27, 28]

